Tesla Inc. (NASDAQ:TSLA) was trading flat in the premarket on Wednesday after gapping down to start the trading day on Tuesday, but rising up to close that session flat.
BYD Co (OTC:BYDDY), a Warren Buffett-backed Chinese EV and battery maker, confirmed Wednesday that it will soon begin delivering batteries to Tesla. The LFP battery cells are expected to be used in Model 3 and Model Y vehicles produced at Tesla’s Shanghai facility.
Previously, China’s CATL held the title as the only battery supplier of the two EV models.
On Tuesday, Cathie Wood-led Ark Invest Investment Management accumulated an additional 3,000 shares of Tesla. On May 23, the fund made its first purchase of Tesla shares since February, buying 15,858 shares of the EV giant.
Between February and May 23, ARK Investment Management was reducing its exposure, which included dumping a massive $66 million worth of the stock on the day of Tesla’s first-quarter earnings print.
Cathie Wood did a good job of grabbing shares near the temporary bottom on May 23, and the fund’s purchase on Tuesday means Wood believes averaging up slightly is the best play. Tesla is in a tricky spot, however, signaling both bullish and bearish indicators on its chart.
Want direct analysis? Find me in the BZ Pro lounge! Click here for a free trial.
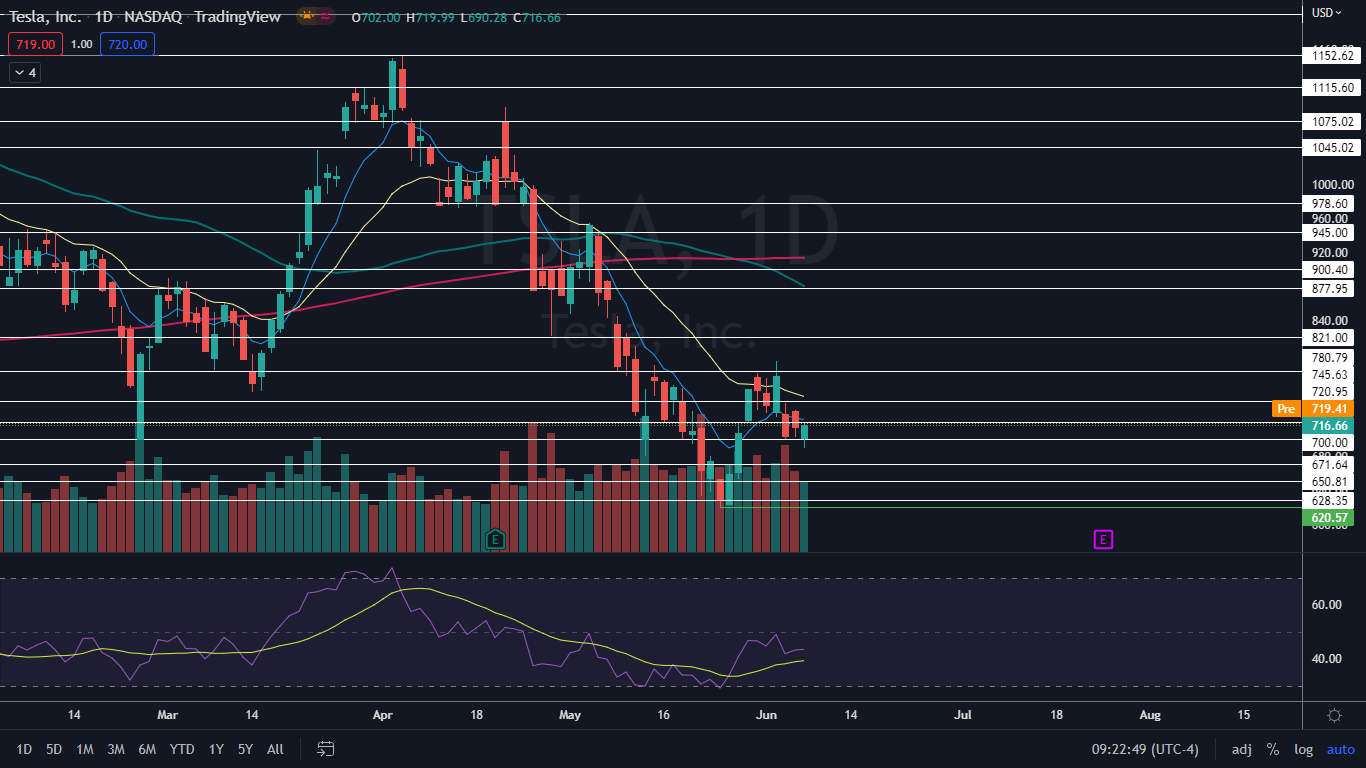
The Tesla Chart: Tesla may have formed a bull flag on the daily chart, although its loss of the eight-day exponential moving average (EMA) on Monday could make the pattern less likely to play out. If the pattern is recognized, the pole was formed between May 25 and May 31 and the flag over the trading days that have followed and the measured move is 25%, which suggests Tesla could soar up toward $863.
- Bearish traders will be watching the flag portion of the pattern closely because within it, Tesla is trading in a confirmed downtrend, with the most recent lower high printed at $733.06 on Tuesday and the most recent lower low formed at t the $690.28 mark the day prior. If Tesla is unable to prove the bull flag is the dominant pattern and negate the downtrend with a higher high, any rise higher may just be to print another consecutive lower high.
- The eight-day EMA has reacted as heavy resistance over the past three trading days, and bullish traders will want to see Tesla regain the level quickly for more confidence going forward. If the stock can regain the level, the 21-day EMA will be the next big area that bulls will want to see secured as support.
- Tesla has resistance above at $720.95 and $745.63 and support below at $700 and $671.64.


