It hasn’t been a good week for the “old faithful” stocks, like Walmart (WMT), Target (TGT) and Deere (DE).
There’s been carnage in the retail space. Walmart and Target had been hit hard after reporting earnings. Farm- and garden-equipment major Deere isn’t dodging the pain, either, down 13% after it reported earnings before the open.
That’s even after Deere beat earnings and revenue expectations, which grew about 20% and 11% year over year, respectively. Further, the company gave a full-year boost to its profit outlook.
If a stock can’t rally -- or at least trade flat -- on that result, then what exactly can management teams do to prevent a stock selloff at this point? Not much.
The overall market action today isn’t doing Deere any favors. Let’s look at the chart, which has support nearby.
Trading Deere Stock
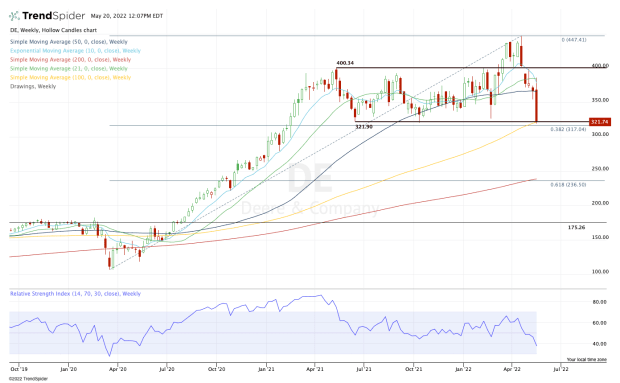
Chart courtesy of TrendSpider.com
On the chart for Deere stock I see a number of levels coming into play in the $320 area. This is called confluence, and it increases the significance of a given area.
For instance, in the current zone we have prior range support, as Deere stock was trapped between $320 and $400. But it’s also where we have the rising 100-week moving average, as well as the 38.2% retracement as measured from the all-time high down to the March 2020 covid low.
Does that mean this area will hold as support?
There are no guarantees. But if it does hold, it’s a very notable area of support. A rebound back toward the $350 area could be in the cards. Above that opens the door to $365 and the 50-day moving average.
On the downside, losing the $300 to $315 area would be a painful blow to the bulls. And below $300 could open Deere stock to more downside.
If the price continues to erode over the next few weeks and months, it could open the door down the $235 to $250 area. There we find the 61.8% retracement and rising 200-week moving average.