
The halting pace of negotiations over the debt ceiling crisis is quite understandably making market participants increasingly nervous. After all, the last time the U.S. government came this close to defaulting on its debt obligations, equity markets absolutely hated it.
History doesn't repeat itself and past performance is not a guarantee of future results. The usual caveats always apply. But a look at what stocks did when debt ceiling negotiations came down to the wire in 2011 is not encouraging at all.
Before we get into the past, however, it is important to emphasize that the vast majority of experts believe that Washington will come to its senses before it's too late in 2023 too.
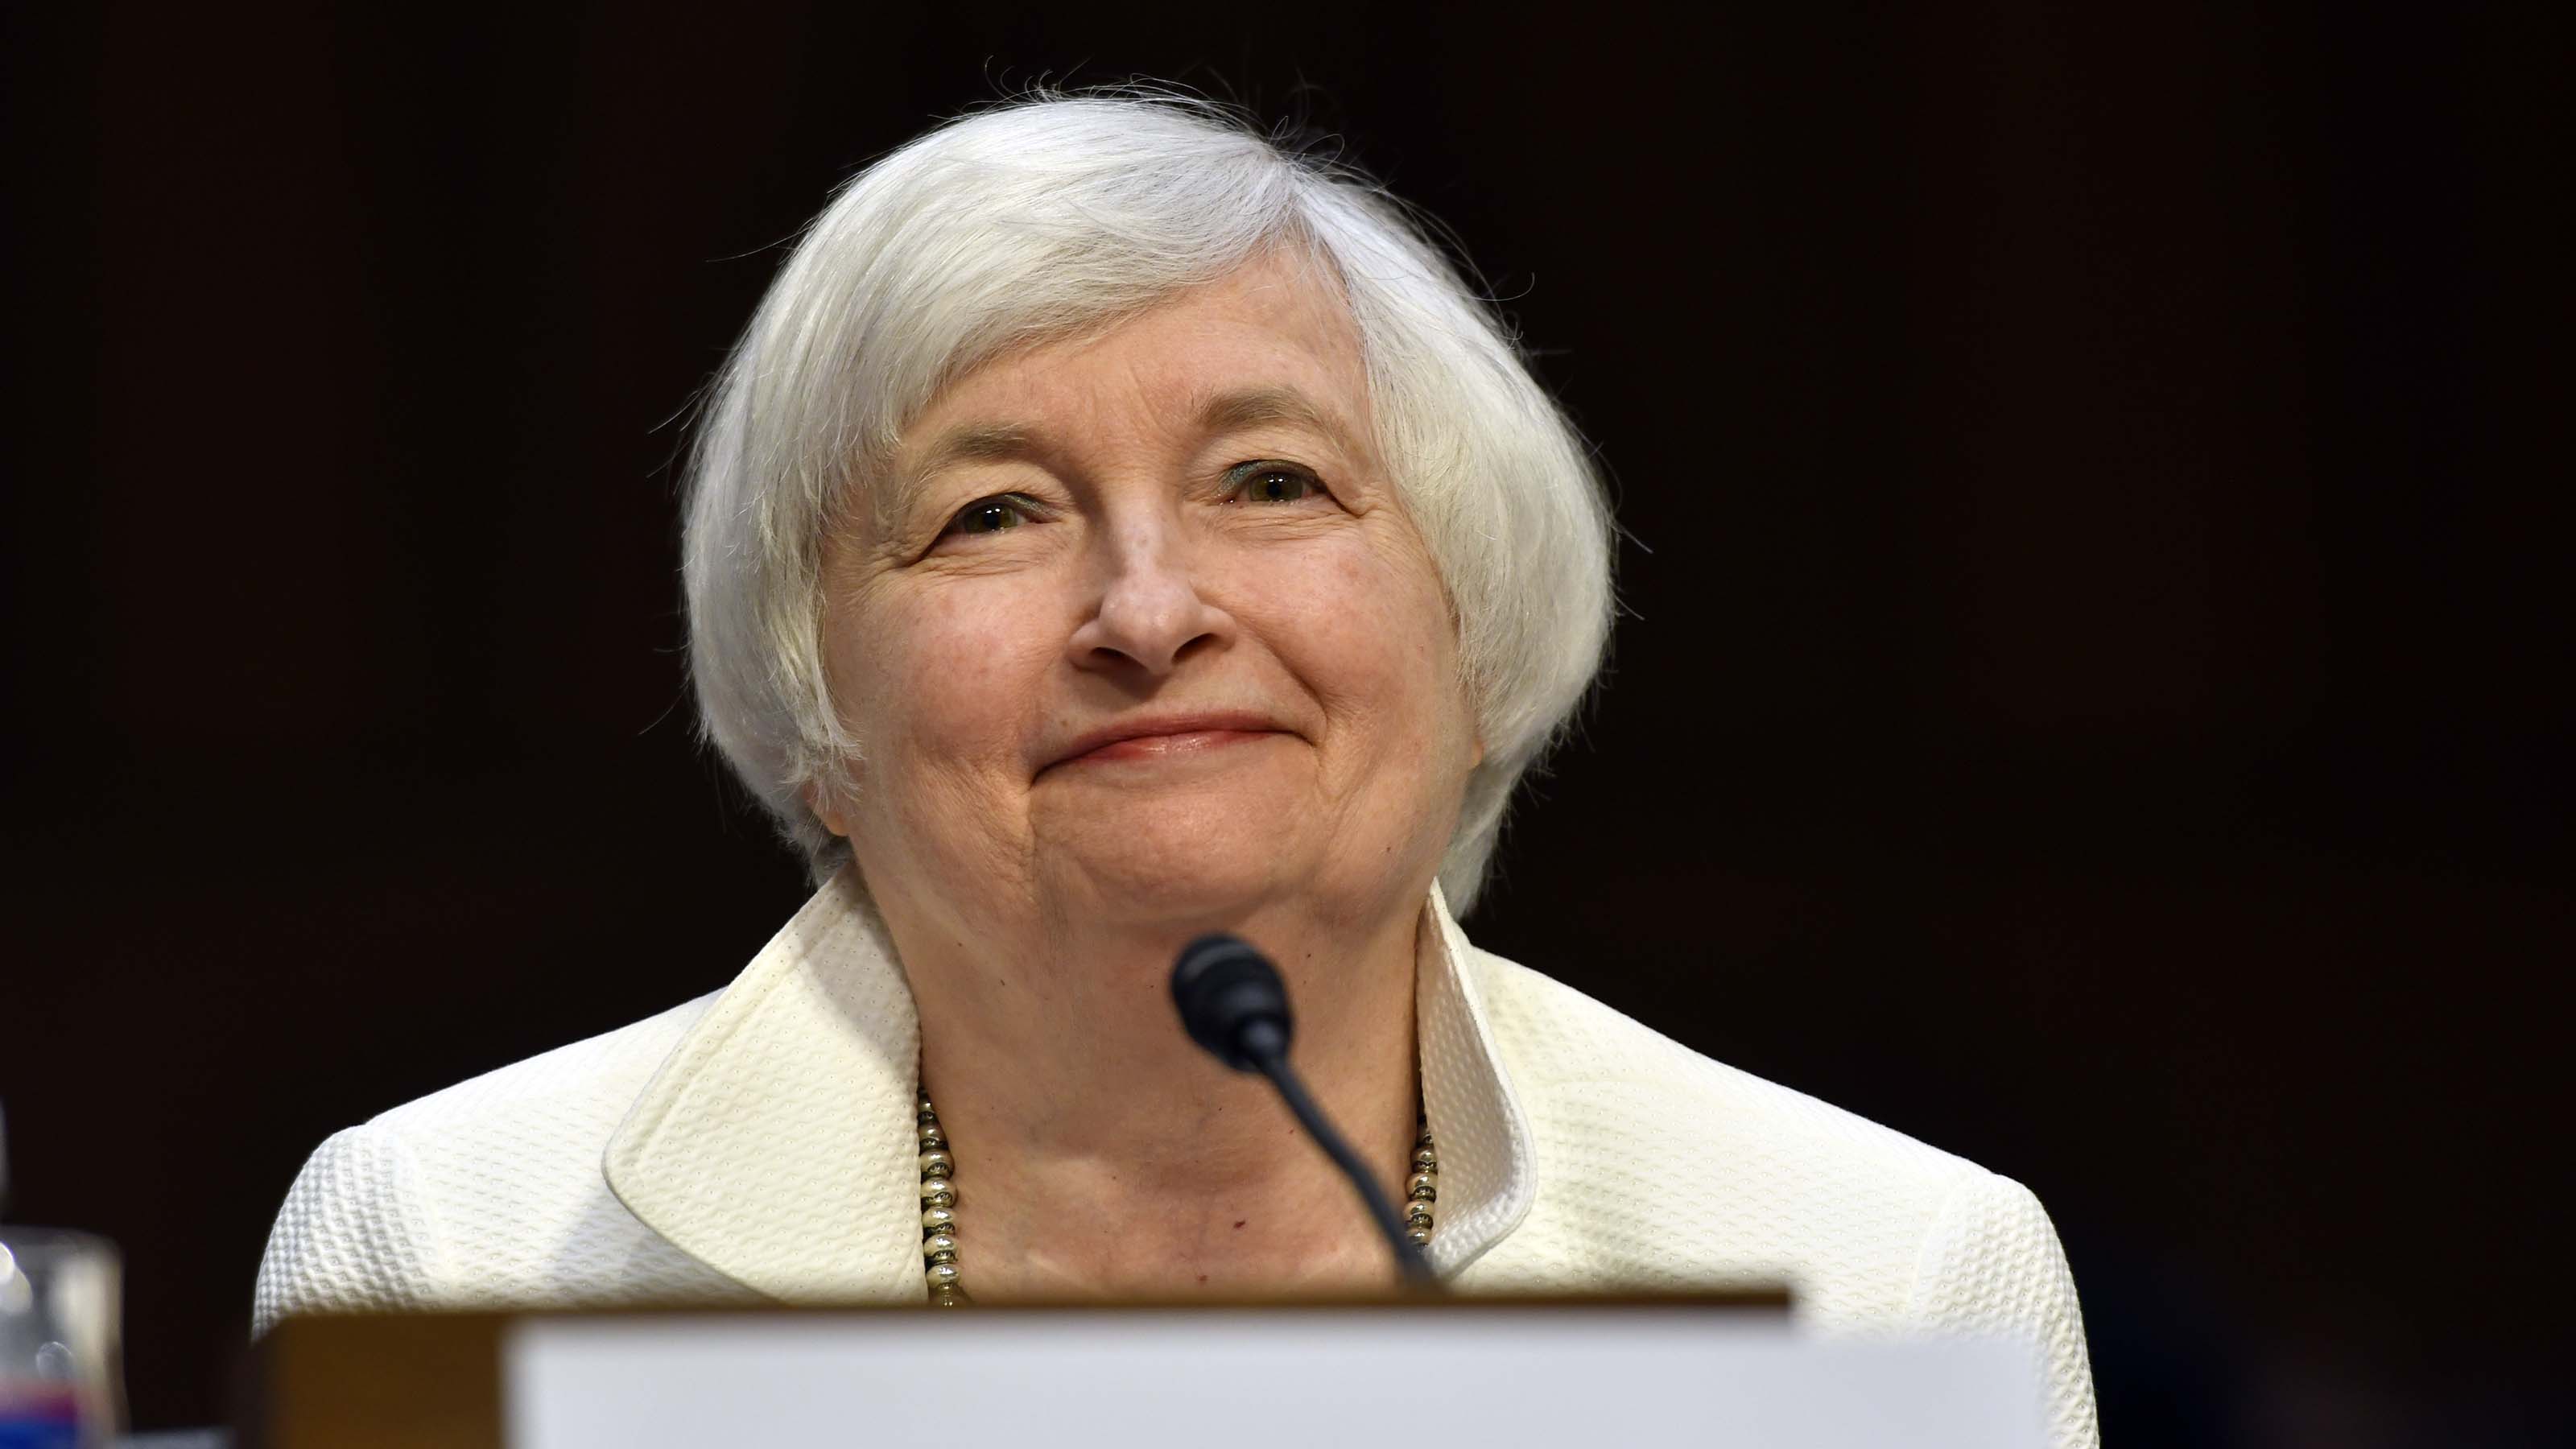
True, lawmakers are getting perilously close to running out of time to raise the debt ceiling. Treasury Secretary Janet Yellen has warned that the federal government could hit the "X-date" – or the day on which it runs out of cash to pay its bills – as early as June 1.
Other calculations suggest the government has more time than Yellen thinks – but not by much. Alec Phillips, Goldman Sachs' chief political economist, said in an interview that X-date is more likely to fall on June 8 or 9.
Either way, the odds of actually getting to X-date remain extremely remote. The market for credit default swaps on U.S. debt is pricing in a 2% probability of a technical default. Most economists, strategists and portfolio managers also believe the government will get its act together on the debt ceiling in time.
"We see roughly a 60% probability of a short-term extension pushing X-date to September 30 or slightly beyond; a 30% probability of a resolution by early June; an 8% probability of no action by Congress resulting in Biden invoking the use of the 14th amendment; and a 2% probability of an outright Treasury default," notes Steven Zeng, U.S. rates strategist at Deutsche Bank.
The problem for equity investors is that the last time Washington cut it this close on raising the debt ceiling, markets sold off sharply and went on to deliver an essentially flat return for the calendar year.
Stocks in the debt ceiling crisis of 2011
The closest historical parallel to Washington's current game of debt-ceiling chicken came in the summer of 2011. Republicans agreed to raise the debt ceiling on July 31 – or just two days before the government expected to run out of cash. Catastrophe was avoided, but just barely. The brinkmanship even led Standard & Poor's to take the once unthinkable step of cutting the federal government's long-term credit rating.
It wasn't a fun time. As analysts at JPMorgan Chase recall: "Risk assets reacted negatively: the dollar sold off, stocks sank and credit spreads widened. But a strong rally in Treasuries (driven by other percolating market fears at the time like the European sovereign debt crisis) led bonds higher overall."
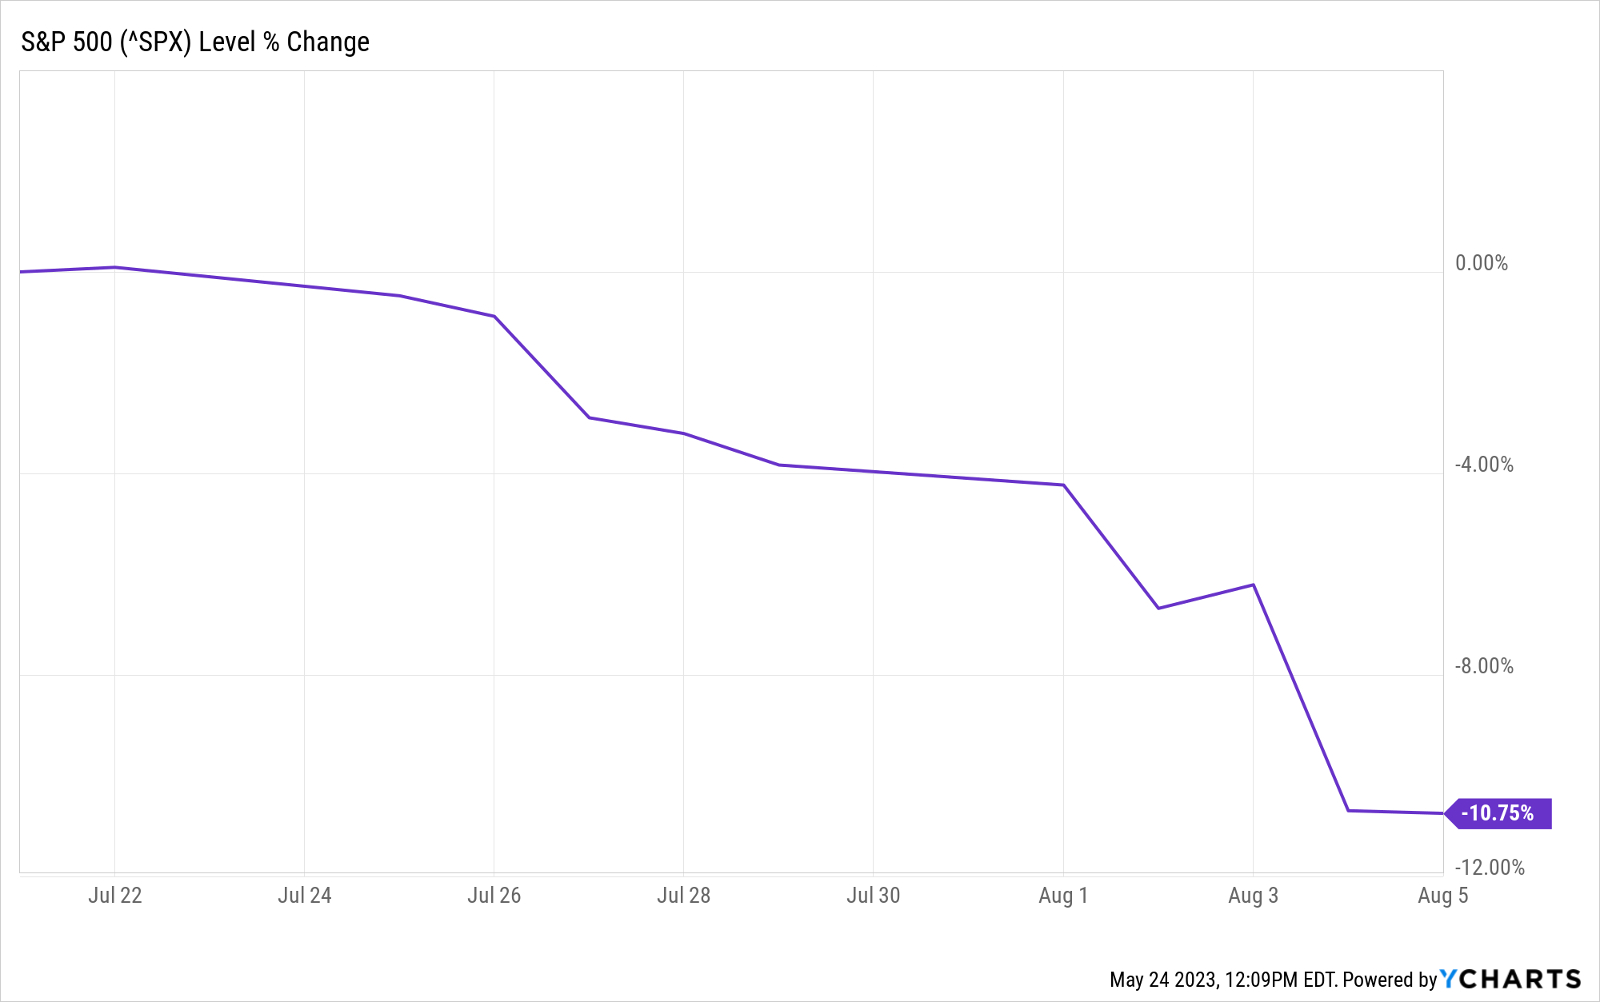
The immediate reaction from the stock market was swift and severe. As you can see in the chart below, the S&P 500 lost almost 11% on a price basis between July 21 – or 10 days before the debt ceiling agreement – and Aug. 5, the day of the S&P credit downgrade.
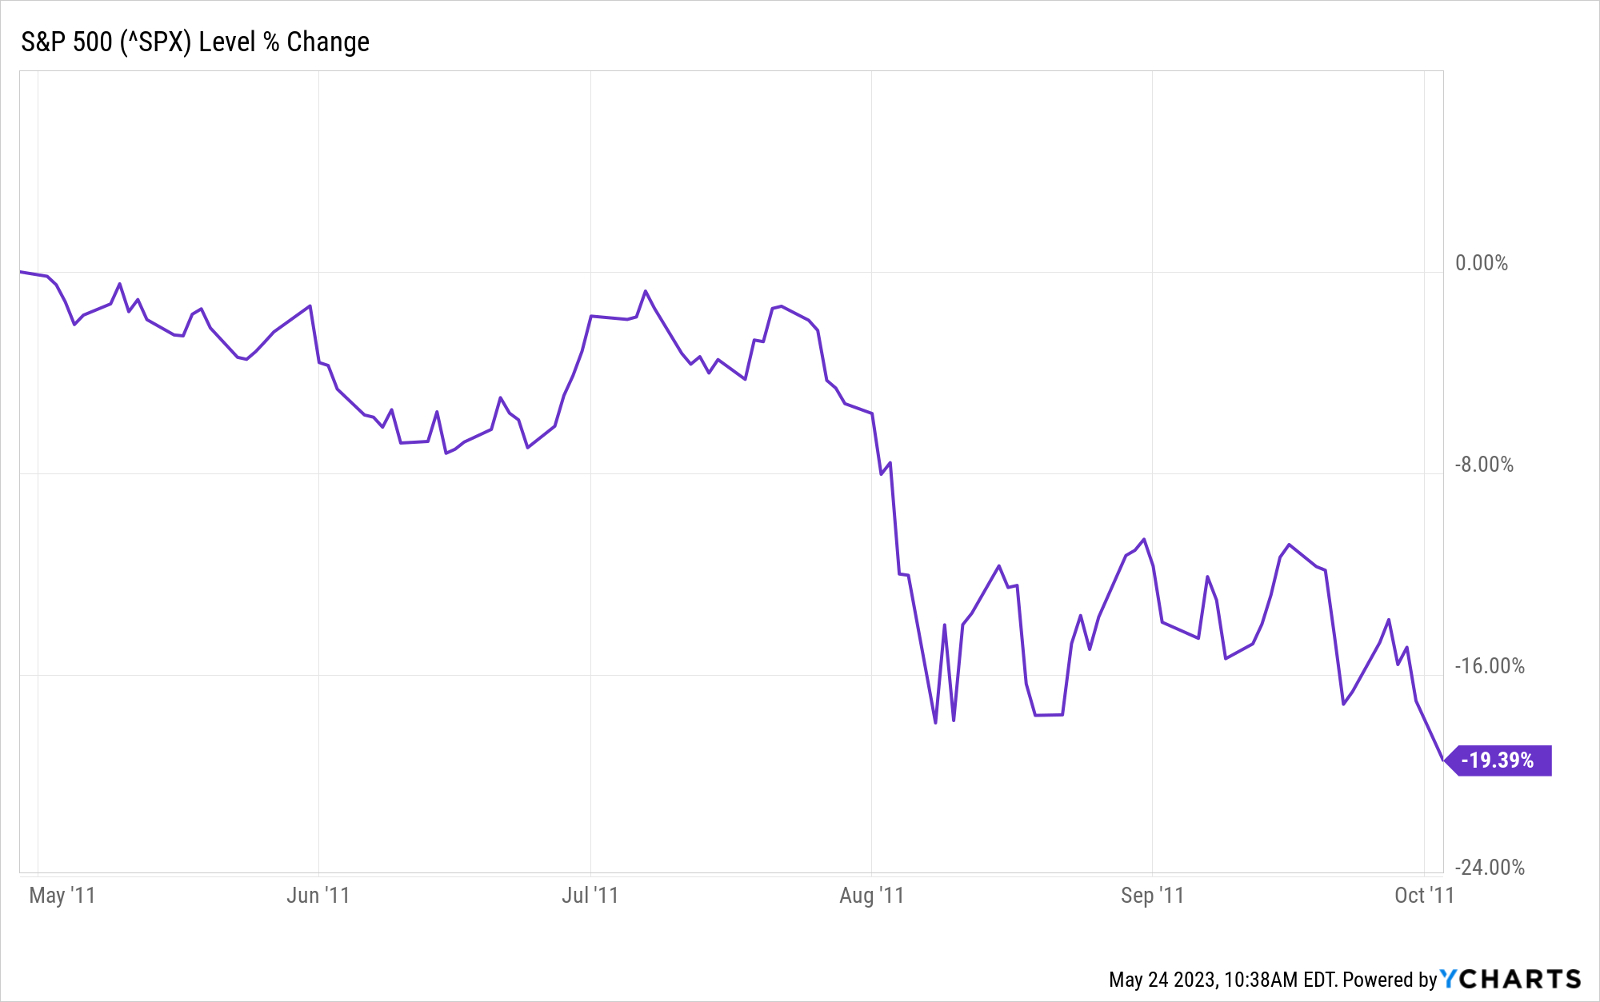
Of course, the above chart shows only a snapshot in time from right around the apex of the debt ceiling crisis. Pressure began building months before, and the market wasn't done fumbling for a bottom for many, many weeks. Ultimately, from the S&P 500's closing 2011 peak to its closing 2011 trough, the index lost more than 19% on a price basis. Have a glance at what that looked like in the chart below:
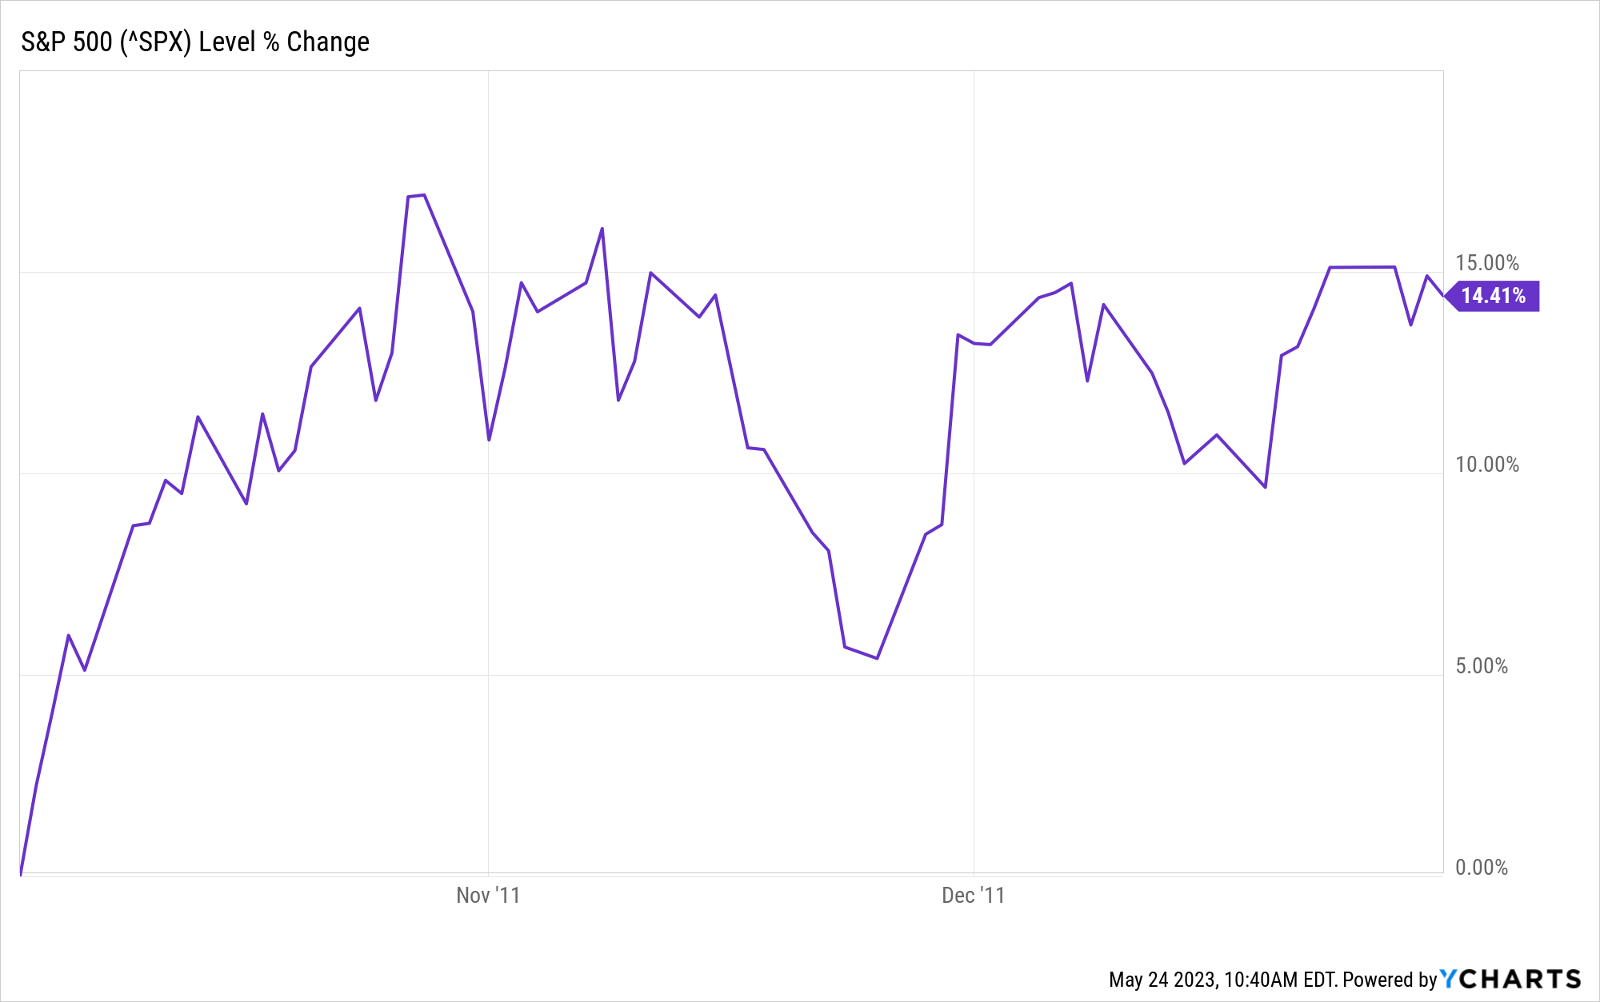
Markets did recover in the fourth quarter, however. Indeed, anyone who timed it perfectly that year grabbed hold of a rally of almost 15% through the end of 2011:
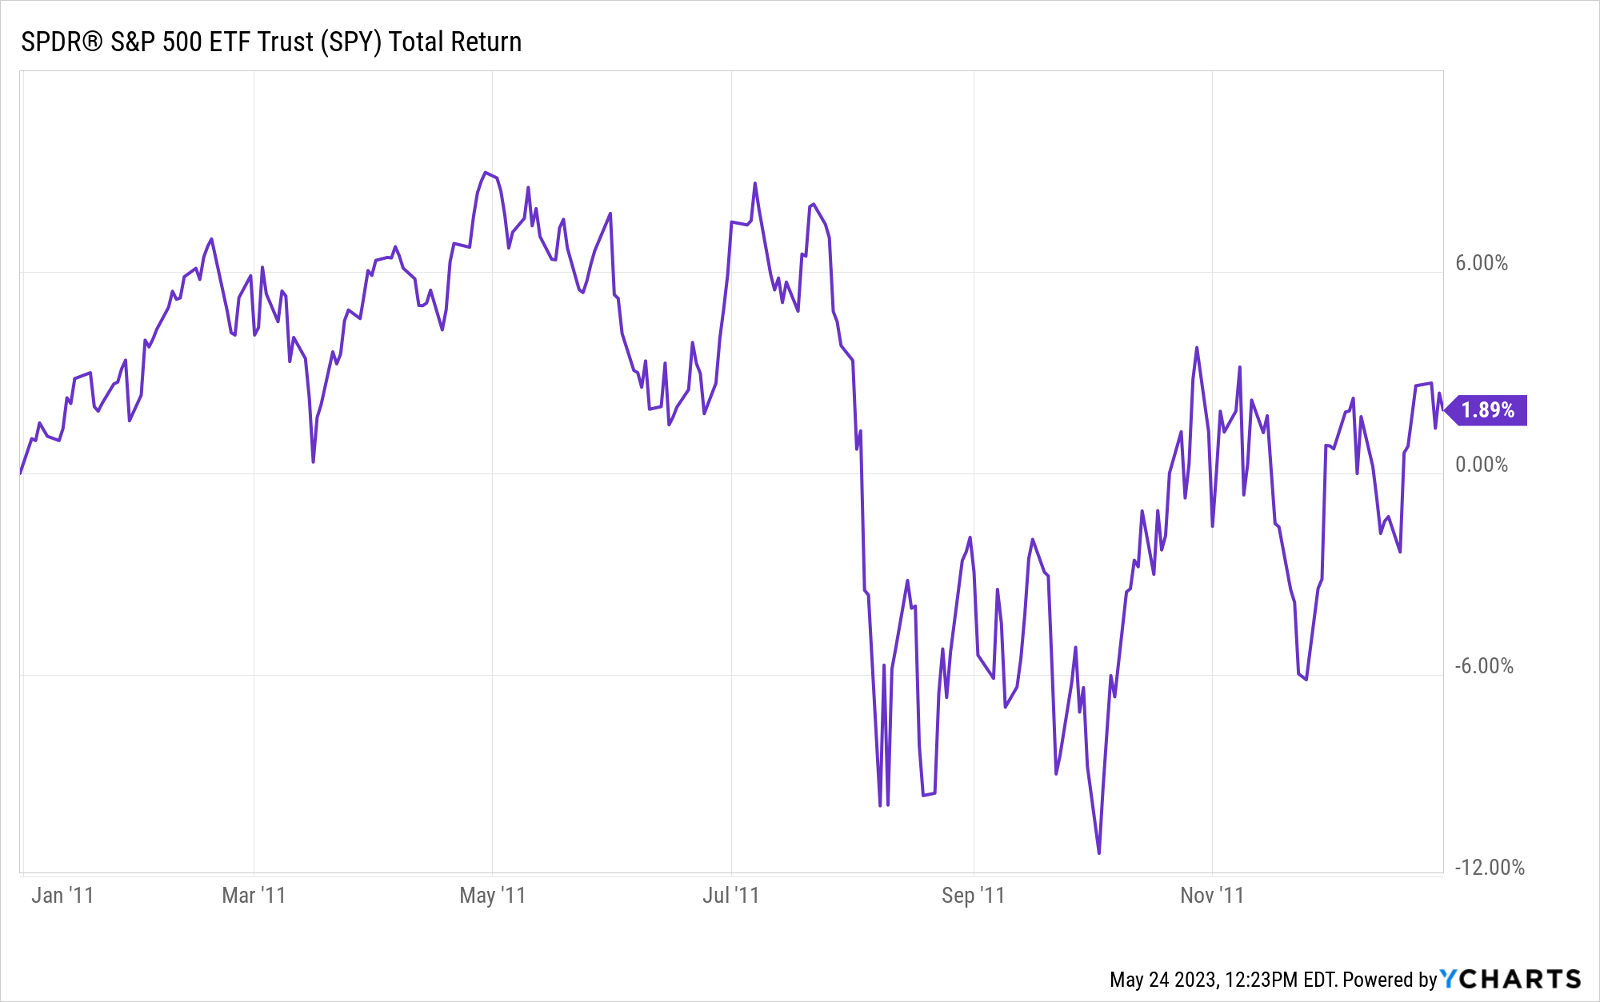
Nevertheless, taken as a whole, calendar 2011 was pretty much a lost year for equity investors. The market at one point had been on pace to deliver double-digit-percent returns. Instead, the debt ceiling crisis turned stocks into a dud. The S&P 500 was flat on a price basis in 2011.
Have a look at the chart below and you'll see that even on a total return basis (price change plus dividends), the SPDR S&P 500 Trust ETF (SPY) generated a gross return of not even 1.9%.
If nothing else, the events of 2011 suggest that Washington needs to reach a deal on the debt ceiling as soon as possible. Leaving an agreement to the very last minute had dire consequences for equities the last time around. And no one wants to go through that again.


