It’s one thing to learn about the impact of global climate change in general terms, it’s quite another thing to study how climate change will affect your neighborhood, community, and even your home.
That’s what Caleb Rice’s physical science students at Lake Worth Community High School recently learned when the class participated in a pilot program utilizing hyper-local climate change data. The data sets are integrated with geographic information system (GIS) mapping and visualization programs, and were made available through a partnership between AT&T and EcoRise, a nonprofit dedicated to inspiring a new generation of green leaders by working with K-12 students.
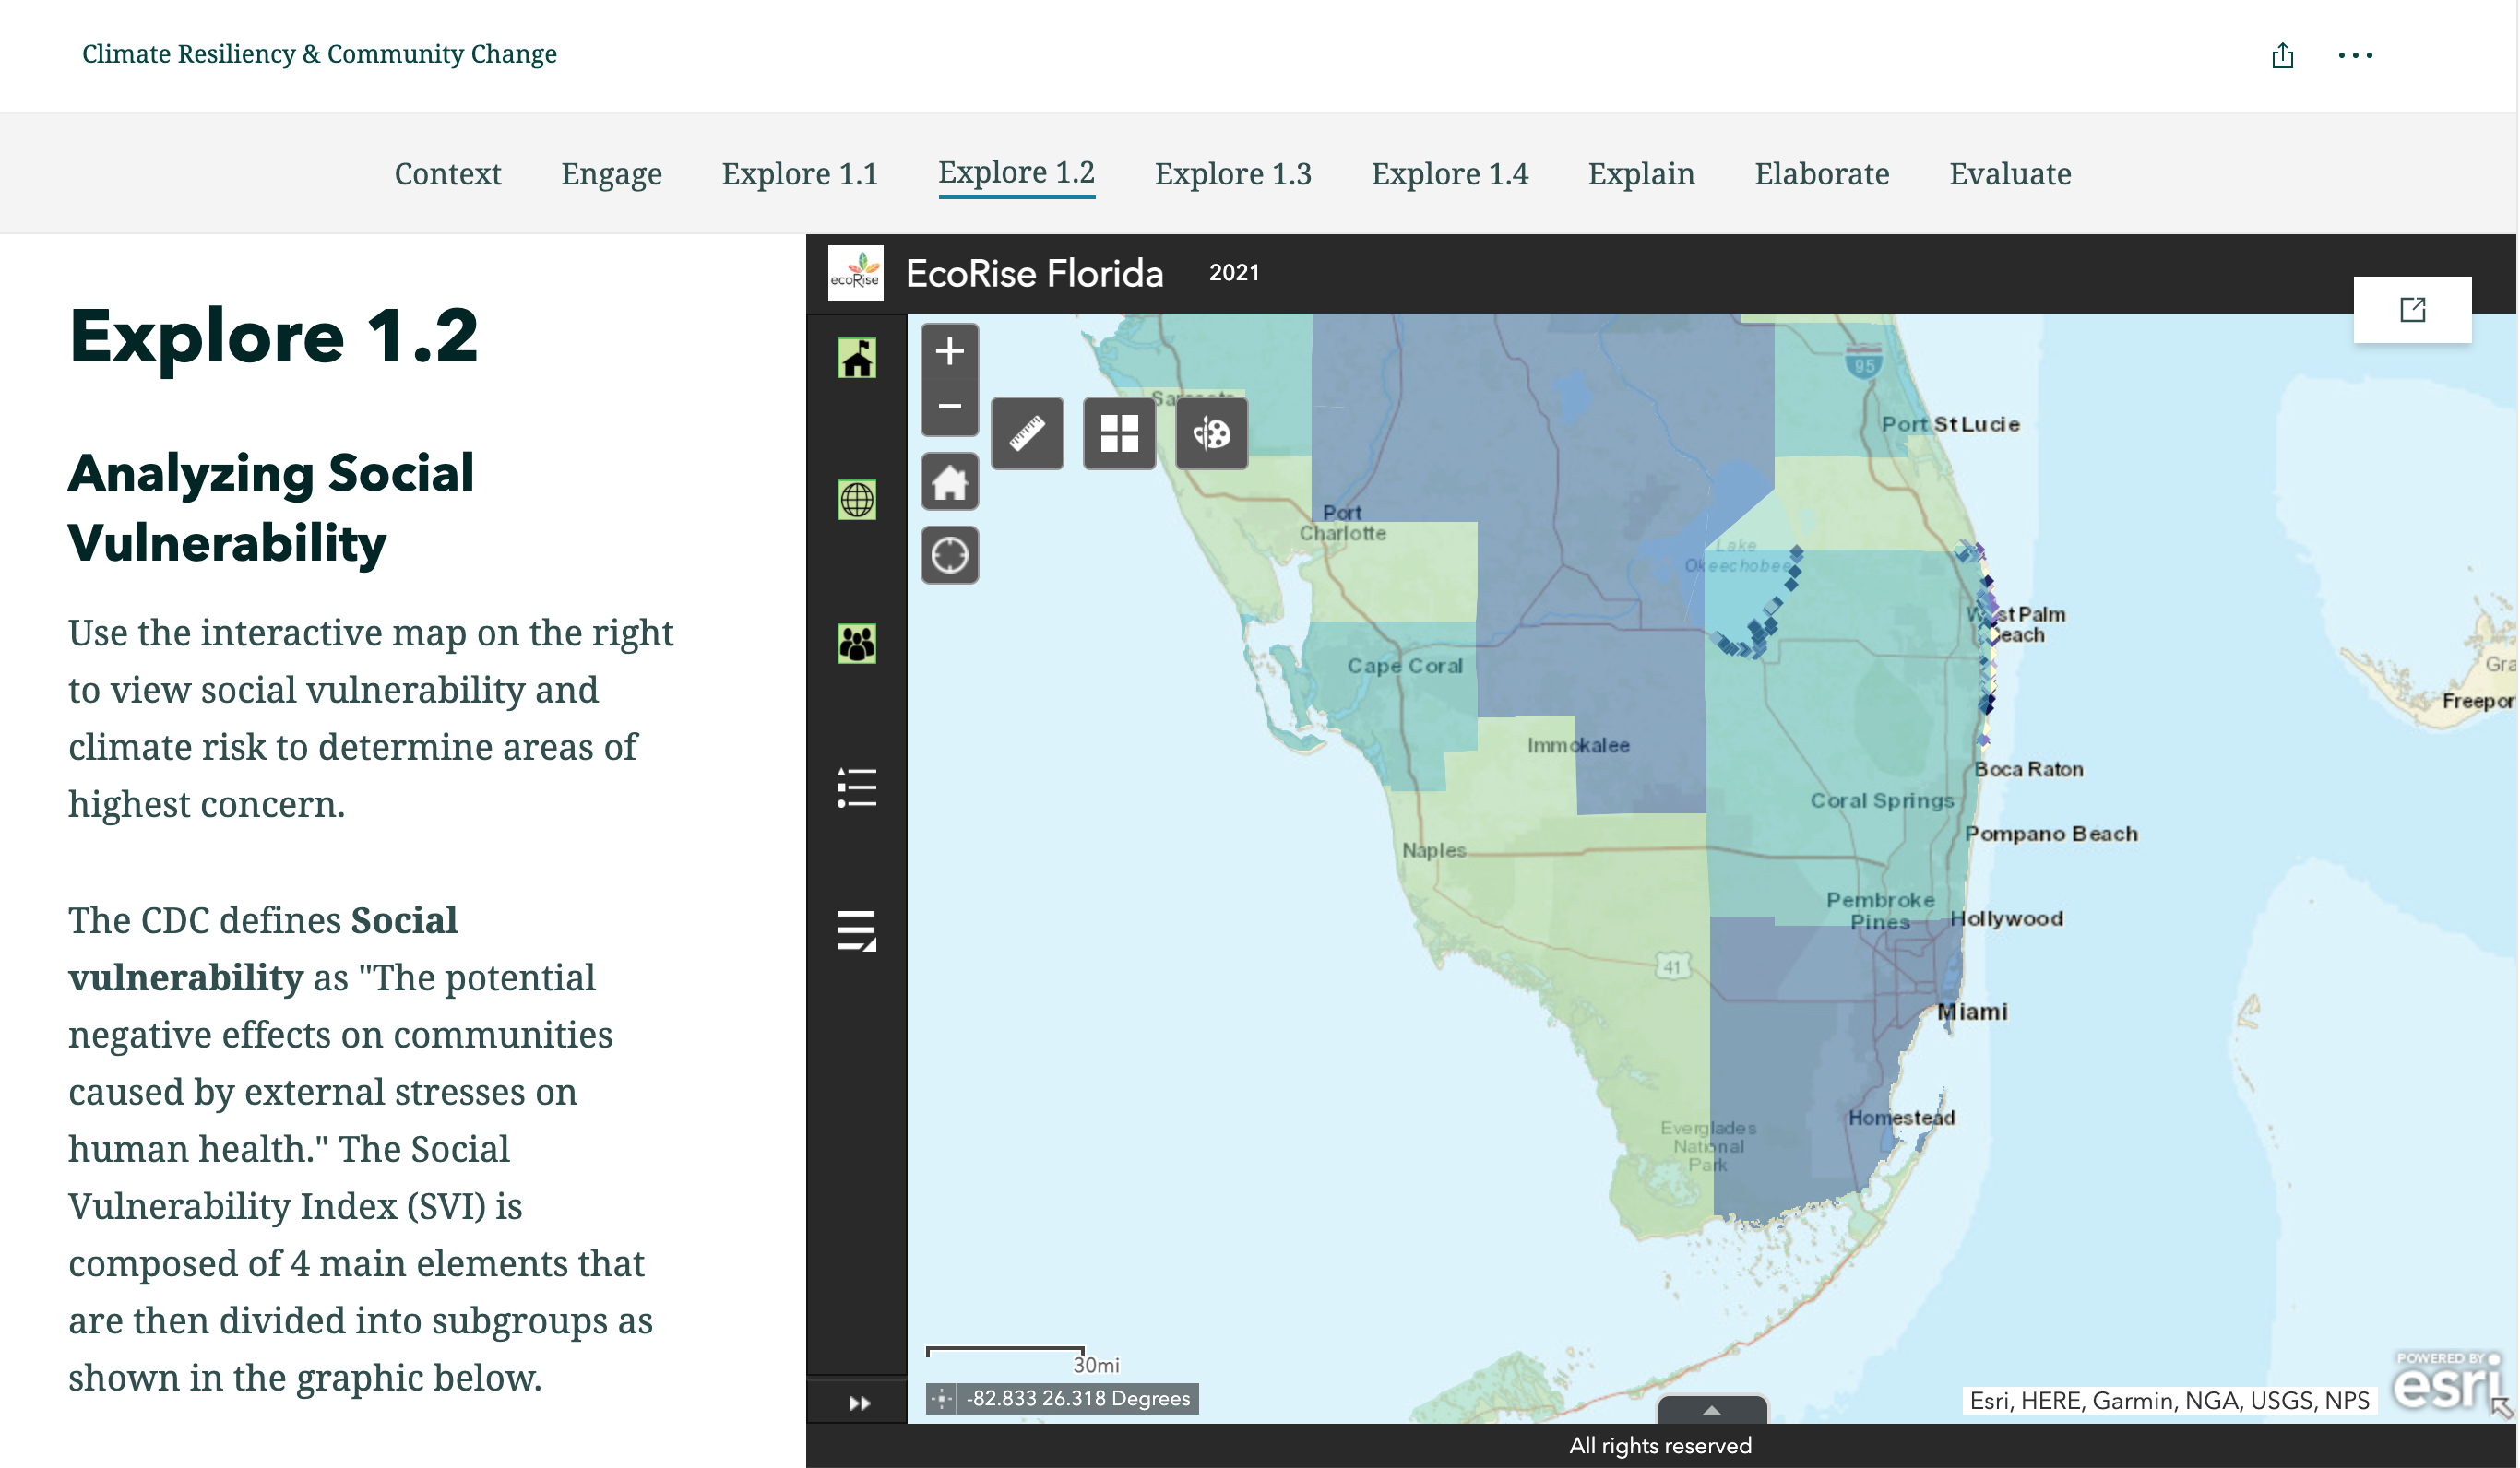
Students in Rice’s class were able to zoom in on their school and neighborhoods and then utilize flood projection data and wind data to evaluate areas most susceptible to flooding, using a 50-year projection. While doing this, they explored ways to create advocacy tools and support preparation strategies for climate resilience projects for areas most at risk.
“Once they started learning about climate resiliency, they got really connected to the subject, especially when we started talking about the social vulnerability index,” Rice says. “Our area has a high social vulnerability index, and they were able to discuss different facets of gentrification and what they have seen, and how that connects to the coastal flooding and people at risk when disasters happen.”
“Analyzing the data, synthesizing all these topics, will help our students not only in the science content area, but also in math, social studies, and English,” says Venkata-Suseela Tadepalli, a science coach and department chair at Lake Worth High School. “I will definitely push to expand this program to other subject areas.”
Finding And Using the Data
The project came about after staff at EcoRise learned that AT&T had a new climate resilience project. “They were partnering with an organization to collect data that was extremely detailed in terms of forecasting climate risks, and there was a GIS mapping component,” says Gina LaMotte, founder and president of EcoRise. “This data for them was for business -- understanding what the climate risk level and vulnerability was for their customers and their infrastructure. But they were really forward thinking in understanding that this information could be utilized by the community at large.”
Combining this new data with resources, EcoRise has created a powerful resource for educators and students to study climate change and much more. “It's about how we take this into our lives and stand up as a leader and take action right now,” she says. “Young people spend 14,000 hours in a classroom and there's an opportunity for them to be actively solving and supporting the solutions in our communities -- it's not just up to the adults, young people have the opportunity to also contribute their ideas and their actions.”
How to Utilize It In Your Class
Educators interested in learning more should visit the Climate Risk and Resilience Portal (ClimRR) as well as the EcoRise’s Gen: Thrive Tools site.
The data AT&T has collected so far focuses on coastal concerns such as flooding and high winds, but plans are underway to collect more data about environmental concerns such as wildfire risks and urban heat islands (urban areas that experience heightened temperatures).
In the meantime, Gen: Thrive already has other data layers embedded in its mapping tool. “Students can look at other environmental issues like polluted waterways and hazardous waste sites, and there's certainly a lot in terms of environmental justice issues and equity,” LaMotte says.
Rice advises other teachers who plan on using these tools in the classroom to let students take the reins. “I've had a lot of success using a collaborative learning strategy with the students where they've been engaged together in small learning groups,” he says. “They've been bouncing ideas off each other while I'm more taking a backseat approach, facilitating.”


