Bank of America Corporation (NYSE:BAC) and JP Morgan Chase & Co (NYSE:JPM) opened higher on Wednesday in tandem with the S&P 500, but selling pressure entered just after 9:35 a.m., when Newsweek released an exclusive report stating a full-scale Russian invasion of Ukraine was likely within 48 hours.
Both stocks have been trading in a downtrend since Feb. 10 when Bank of America reached a new all-time high of $50.11 and JPMorgan a high of $159.03, declining about 10% and 5%, respectively, since that date.
Although both are trading in a bearish falling channel pattern on the daily chart, a bullish break could send both stocks soaring. If JPMorgan is able to reverse course, it may have further room to run because the stock may also be settling into a bull flag pattern on the weekly chart.
It should be noted that events affecting the general markets, negative or positive reactions to earnings prints and news headlines about a stock can quickly invalidate patterns and breakouts. As the saying goes, "the trend is your friend until it isn't" and any trader in a position should have a clear stop set in place and manage their risk versus reward.
In The News: Since reporting fourth-quarter earnings in mid-January, news for both stocks has slowed. As the March 15-16 Federal Reserve meeting approaches, that may change because the Fed is widely expected to raise interest rates in order to reduce skyrocketing inflation.
When interest rates rise, net interest margins widen, which is beneficial for banks because adjustable-rate loans reset quickly while pay outs on deposits move more slowly. Most Fed officials support a quarter-point raise to be announced next month but on Feb. 21 Federal Reserve Governor Michelle Bowman said she is in support of a half-point rate hike.
See Also: CNBC's Final Trades: Walmart, Union Pacific, JPMorgan Chase And This Agro Stock
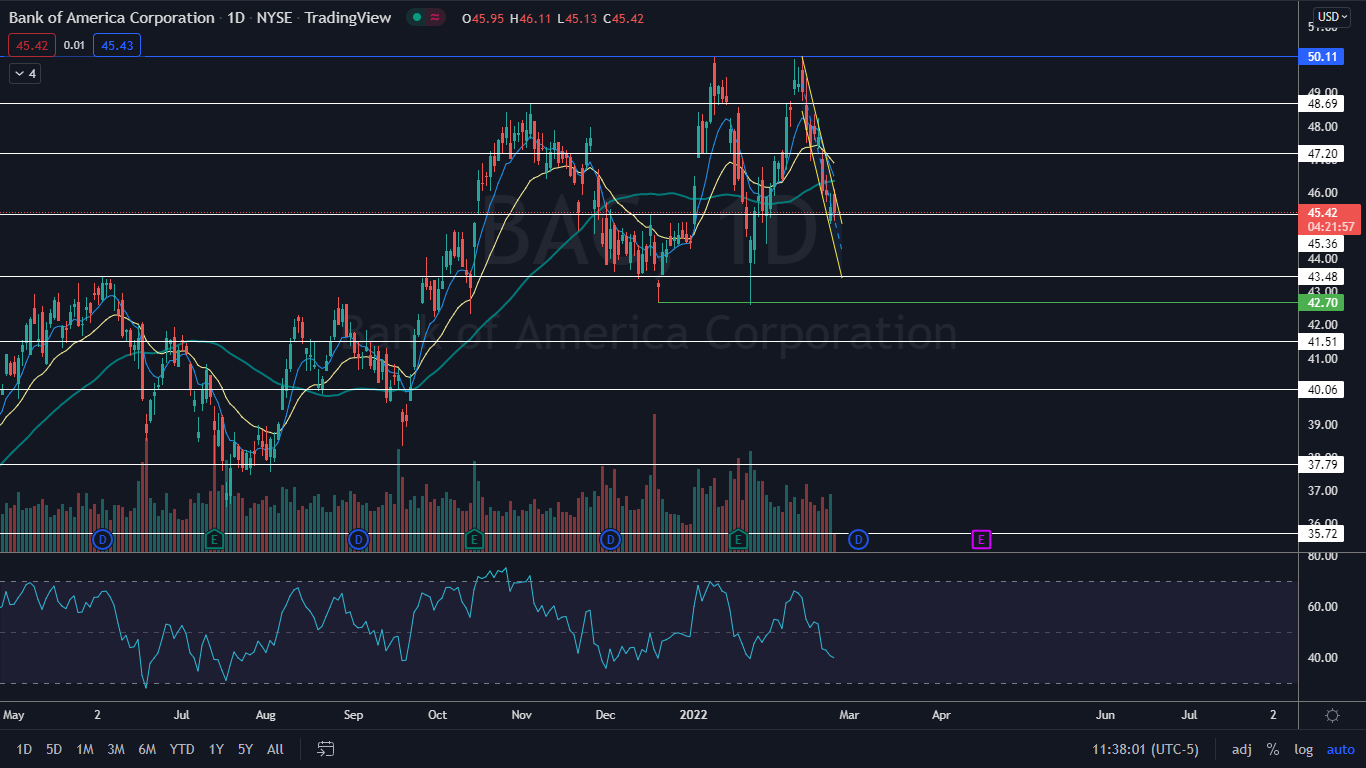
The Bank of America Chart: On Wednesday, Bank of America attempted to break up bullishly from the falling channel but rejected the upper descending trendline when Ukraine/Russia news was printed. The stock may find support at the bottom descending trendline of the pattern.
- The decline in price came on lower-than-average volume, however, which indicates consolidation as opposed to fear entering into the stock. As of late morning, only about 15 million shares of Bank of America had exchanged hands compared to the 10-day average of 45.46 million.
- Bank of America’s relative strength index (RSI) has been falling and is currently measuring in at about 38%. When a stock’s RSI nears or reaches the 30% level it becomes oversold, which can be a buy signal for technical traders and indicate a bounce is on the horizon.
- The stock has resistance above at $45.36 and $47.20 and support below at $43.48 and $41.51.
Want direct analysis? Find me in the BZ Pro lounge! Click here for a free trial.

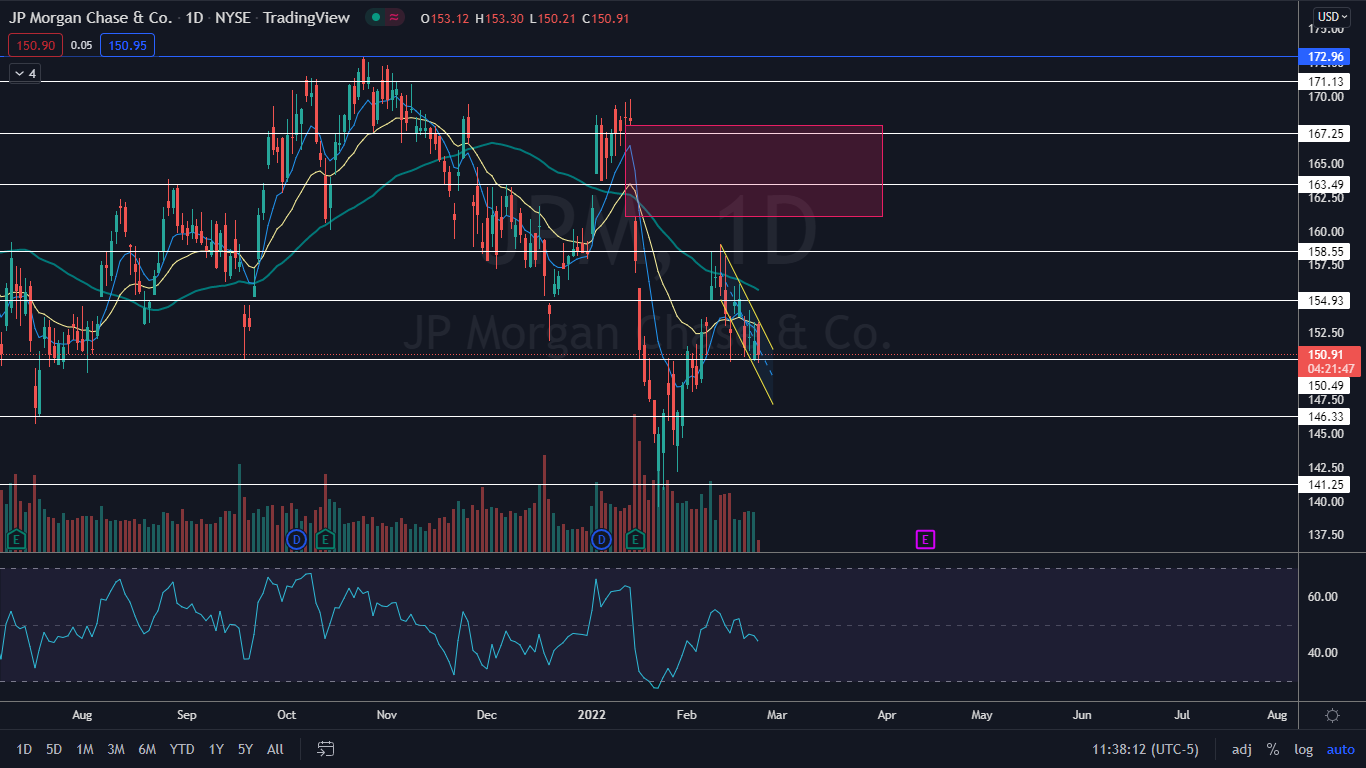
The JP Morgan Chart: Like Bank of America, JPMorgan attempted to break up from a falling channel on Wednesday but rejected the top of the pattern.
- Also similarly to Bank of America, JPMorgan was trading on lower-than-average volume, with only about 3.25 million shares having exchanged hands by late morning compared to the 10-day average of 13.29 million.
- The stock has a gap above on its chart between $161.03 and $167.89. Gaps on charts fill about 90% of the time so it's likely the stock will trade up to fill that range in the future.
- The stock has resistance above at $154.93 and $158.55 and support below at $150.49 and $146.33.

Photo: Courtesy JPMorgan Chase


