
Roblox Corp (NYSE:RBLX) and Electronic Arts Inc. (NASDAQ:EA) both opened lower on Wednesday, with Roblox kicking off the trading session about 3% lower in sympathy with Electronic Arts, which gapped down 3.25% lower following its third-quarter earnings miss.
Bulls came in and bought the dip on Electronic Arts en masse and by mid-day, the stock was trading more than 4% higher. Roblox continued to consolidate mostly sideways after a 30% move higher between Jan. 28 and Tuesday.
Both stocks look set to head higher if the bullish signals on their charts play out because Roblox may be settling into a bull flag pattern on the daily chart and Entertainment Arts looked to be printing a massive bullish engulfing candlestick, which could indicate an imminent move higher. Roblox may have more room to gain due to how beaten down it has become.
It should be noted that events affecting the general markets, negative or positive reactions to earnings prints and news headlines about a stock can quickly invalidate patterns and breakouts. As the saying goes, "The trend is your friend until it isn’t," and any trader in a position should have a clear stop set in place and manage their risk versus reward.
In The News: Although Entertainment Arts reported year-over-year growth, it missed the Zacks consensus estimate. The gaming giant reported earnings per share of 23 cents, missing the estimate of $3.22 and revenue of $1.79 billion, which came in far below the $2.66 billion estimate.
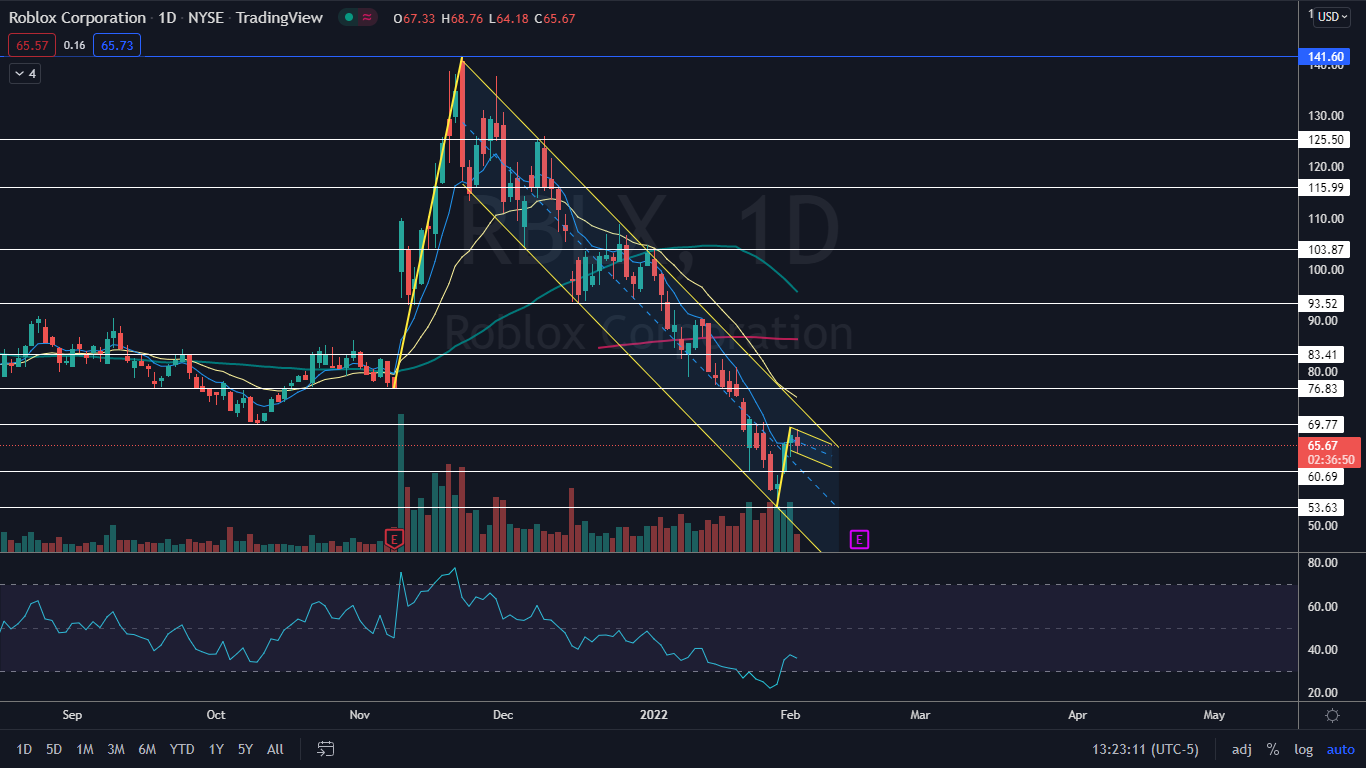
Roblox is expected to print its fourth-quarter earnings on Feb. 15 after the market closes and traders and investors may be waiting to see the results before taking a position. When the company reported third-quarter revenue growth on its last earnings print on Nov. 8, the stock gapped up 26% higher the following day and ran 42% higher over the nine trading days that followed to reach an all-time high of $141.60.
See Also: Is Roblox The Ultimate Metaverse Stock? Key Data From 2021
The Roblox Chart: Roblox may be settling into a bull flag pattern on the daily chart, with the pole created between Jan. 28 and Tuesday and the pole beginning to form since then. The stock may need to trade within the pattern for a few more days before breaking up from the pattern on higher-than-average volume to confirm the pattern or falling down more than half the length of the pole, which would negate the pattern.
- If the bull flag pattern is recognized Roblox may gain the power to break up from a long-term calling channel it has been trading in since reaching its all-time high. If Roblox is able to break up from both the bull flag and the falling channel pattern it could indicate a much larger reversal to the upside is in the cards.
- Roblox has resistance above at $69.77 and $76.83 and support below at $60.69 and the all-time low of $53.63.
Want direct analysis? Find me in the BZ Pro lounge! Click here for a free trial.
The Electronic Arts Chart: Electronic Arts was soaring on Wednesday and printing a candle that has engulfed all the candlesticks from the prior six trading days. If Electronic Arts closes the trading day near its high-of-day price, it could indicate higher prices will come again on Thursday.
- If higher prices don’t come, Electronic Arts is likely to print an inside bar on the daily chart. In this case, the pattern would learn bullish because the stock was trading higher before falling into the pattern.
- The stock has resistance above at $135.43 and $138.59 and support below at $133.03 and $130.50.
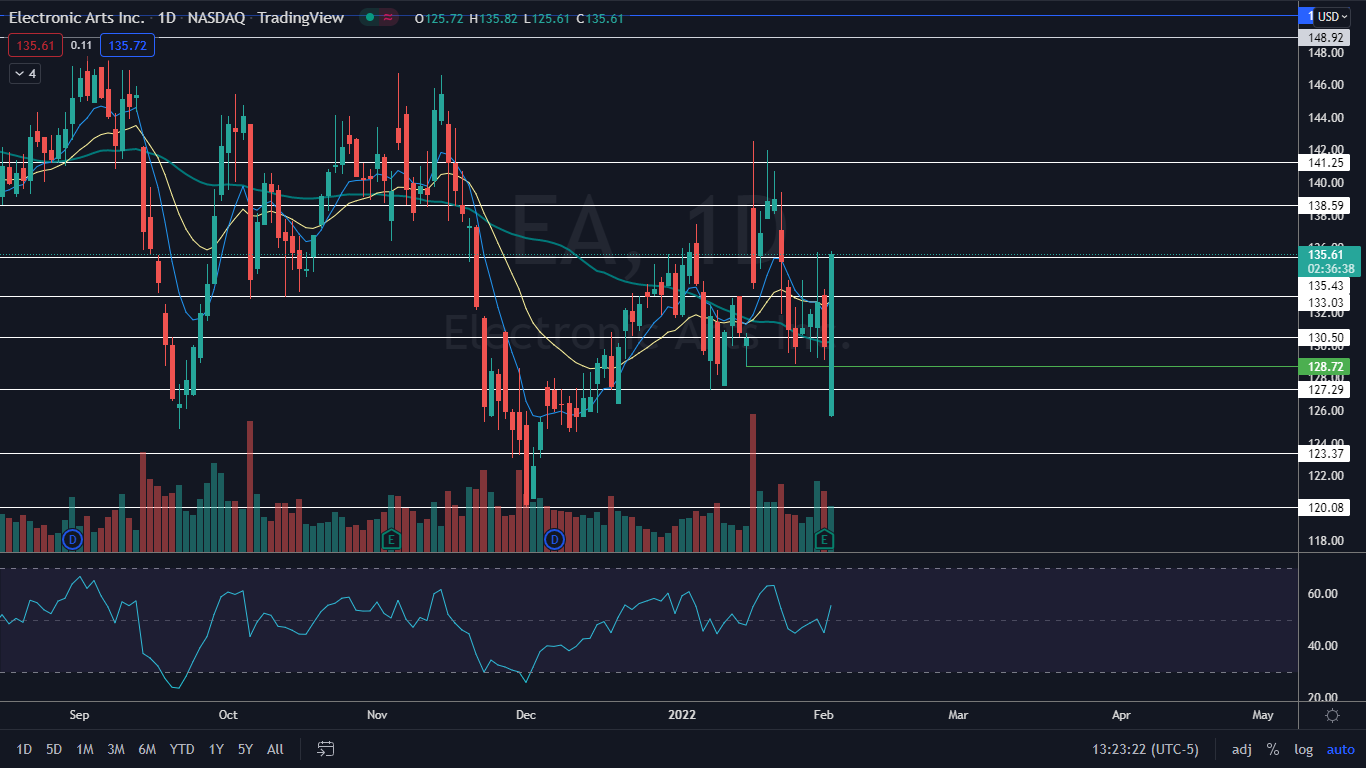
Photo by Fredrick Tendong on Unsplash