Snap, Inc (NYSE:SNAP) and Pinterest, Inc (NYSE:PINS) were trading 8% higher at one point on Wednesday, as the general markets rebounded from a steep 4-day downturn during which the S&P 500 declined over 5%.
The social media stocks have been heavily beaten down over the past months, with Snap declining almost 60% from its Sept. 24, 2021 all-time high of $83.34 and Pinterest plummeting about 72% from its all-time high of $89.90 printed on Feb. 16 of that same year.
Both stocks have started to show signs the bottom may be in, although Pinterest may offer traders and investors less risk because it has confirmed a breakout from a pattern, while Snap is still in the pre-breakout stage.
It should be noted, however, that events affecting the general markets, negative or positive reactions to earnings prints and news headlines can quickly invalidate patterns and breakouts. As the saying goes, "the trend is your friend until it isn't" and any trader in a position should have a clear stop set in place and manage their risk versus reward.
See Also: Here's How Benchmark Views Twitter, Pinterest, Snap
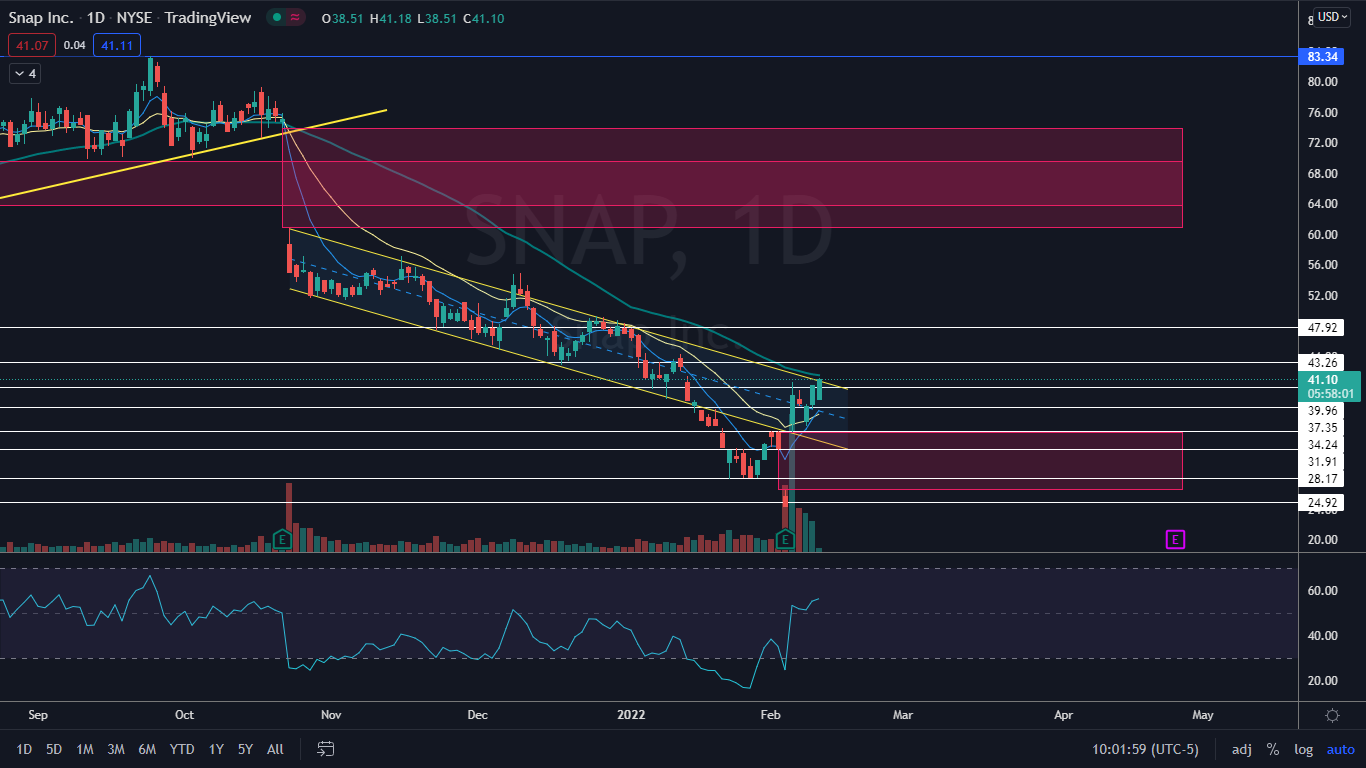
The Snap Chart: On March 7 and March 8, Snap tested the bottom descending trendline of a falling channel pattern that the stock has been trading in since Oct. 22. On Wednesday, Snap reacted bullishly to the trendline and shot up towards the channel’s median line.
- A falling channel pattern is considered to be bearish until the stock breaks up from the upper descending trendline of the pattern. Conservative traders may consider waiting to take a position until after Snap breaches the upper trendline, which could indicate a larger move to the upside is on the horizon.
- Snap has one gap below and another gap above the current share price, which the stock is likely to fill in the future. The lower gap was partly filled on Monday and Tuesday, but an empty range remains between $26.49 and $29.58. The upper gap is between $60.78 and the $73.89 level.
- Snap has resistance above at $34.95 and $37.35 and support below at $31.91 and $28.17.
Want direct analysis? Find me in the BZ Pro lounge! Click here for a free trial.

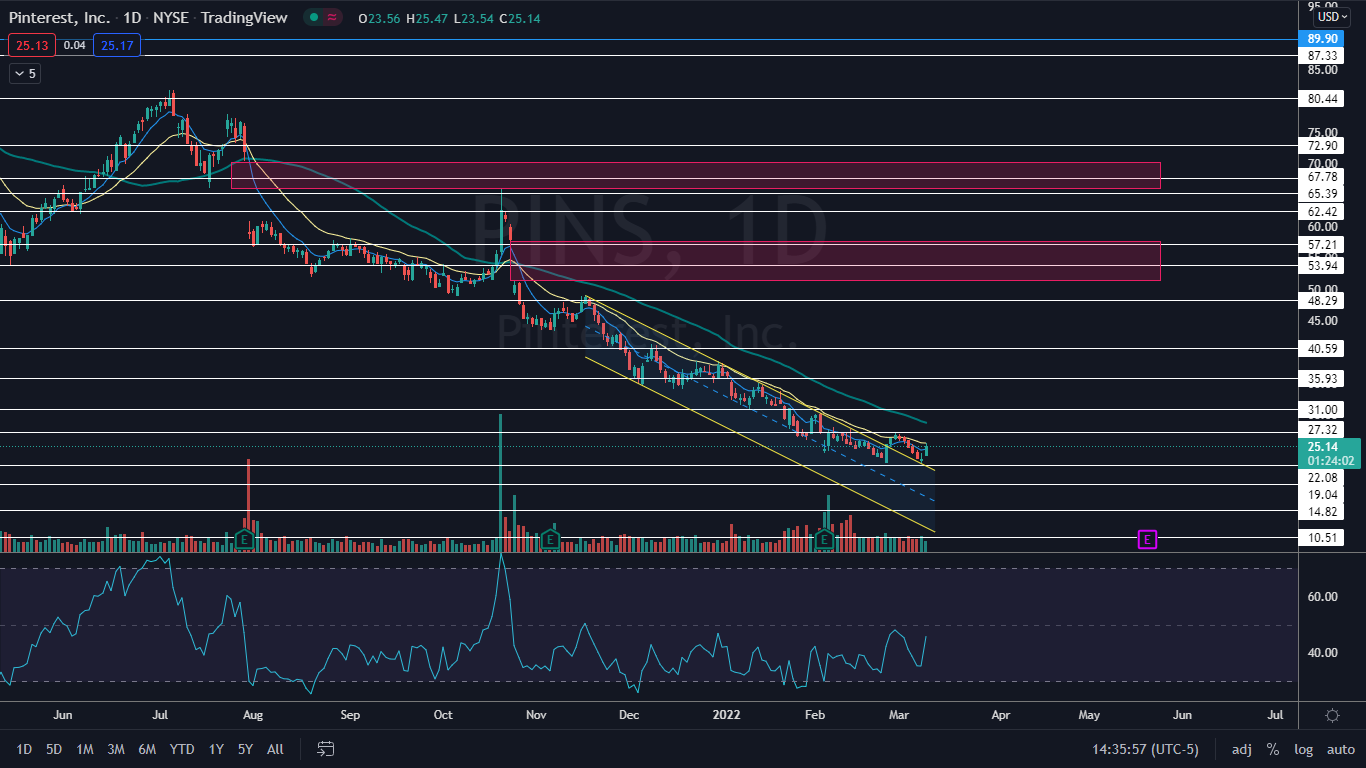
The Pinterest Chart: Pinterest broke up from a falling channel pattern on Feb. 24 and spiked up 7.93% over the two trading days that followed. Between March 1 and March 8, the stock fell down to test the upper descending trendline of the pattern as support and held above that level, which confirmed the pattern was recognized.
- When Pinterest tested the upper descending trendline as support, the stock also printed a bullish double bottom pattern just above the $22 level when combined with similar price action on Feb. 24.
- Pinterest has two gaps above on its chart, with the first gap between $51.39 and $57.63 and the second higher gap between the $66 and $70.20 range. Gaps on charts fill about 90% of the time, so it’s likely Pinterest will trade up into each area in the future.
- Pinterest has resistance above at $27.32 and $31 and support below at $22.08 and $19.04.


