Nio, Inc (NYSE:NIO) and Tesla, Inc (NASDAQ:TSLA) are trading between 5% to 8% higher on Tuesday.
Both stocks have struggled to rebound back toward their all-time highs although Nio has notably had a tougher year, currently trading down 62% from its Jan. 8, 2021 all-time high of $66.99 compared to Tesla, which has lost about 26% from its all-time high of $1,243.49 printed on Nov. 4 of that same year.
Although Tesla has already established itself as the largest producer of electric vehicles, its market share will be challenged as more brands continue to secure their place within the sector. Smart money has also begun to position itself into Nio recently, which demonstrates investors may believe the China-based EV manufacturer has more room to trade higher.
It should be noted, however, that events affecting the general markets, negative or positive reactions to earnings prints and news headlines about a stock can quickly invalidate patterns and breakouts. As the saying goes, "the trend is your friend until it isn’t" and any trader in a position should have a clear stop set in place and manage their risk versus reward.
See Also: This Is How Much In Tesla Shares Elon Musk Gave Away To Charity Last Year
In The News: Bridgewater Associates, led by Ray Dalio, lowered its holdings in Tesla by 60.4% during the fourth quarter of 2021 and added 8.4% to its Nio holdings.
On Monday, it was reported David Einhorn’s Greenlight Capital purchased 1,000 put contracts of Tesla during the fourth quarter in a bet the stock would trade lower. Einhorn’s position marks a renewed bearish interest in Tesla after the long-time foe of Tesla CEO Elon Musk lost big money taking short positions on the stock in 2020.
As more Tesla competitors ramp up production and expand their model options, Nio could have more room for growth with a market cap of just $38.9 billion compared to Tesla’s market cap of a whopping $947.98 billion. For technical traders, Nio’s chart also looks more promising, at least in the shorter term, because the stock is trading in a confirmed uptrend whereas Tesla’s is not.
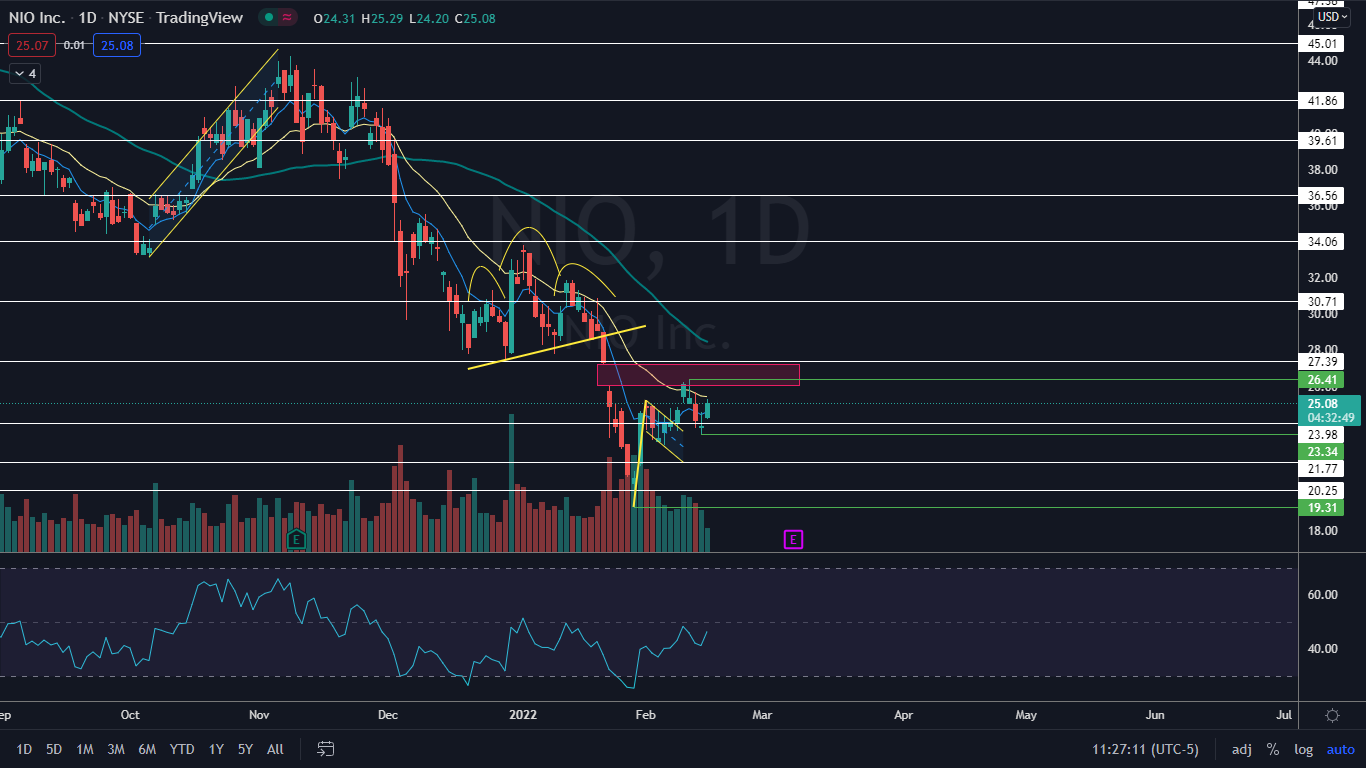
The Nio Chart: Nio reversed course into an uptrend on Jan. 28 and has since printed a consistent series of higher highs and higher lows. Nio’s most recent higher low was printed on Monday at the $23.34 level and the most recent higher high of $26.41 was created on Feb. 10.
- Bullish investors will want to see Nio pop up over the Feb. 10 high-of-day price over the coming days to ensure the uptrend is still intact.
- Nio has a gap above on its chart between $26.41 and $27.22 and the stock is likely to trade up into that range in the future because gaps on charts fill about 90% of the time.
- On Tuesday, Nio regained the eight-day exponential moving average (EMA) as support but was rejecting from the 21-day EMA. Bulls will want to see Nio regain the 21-day EMA quickly.
- Nio has resistance above at $27.39 and $30.71 and support below at $23.98 and $21.77.
Want direct analysis? Find me in the BZ Pro lounge! Click here for a free trial.

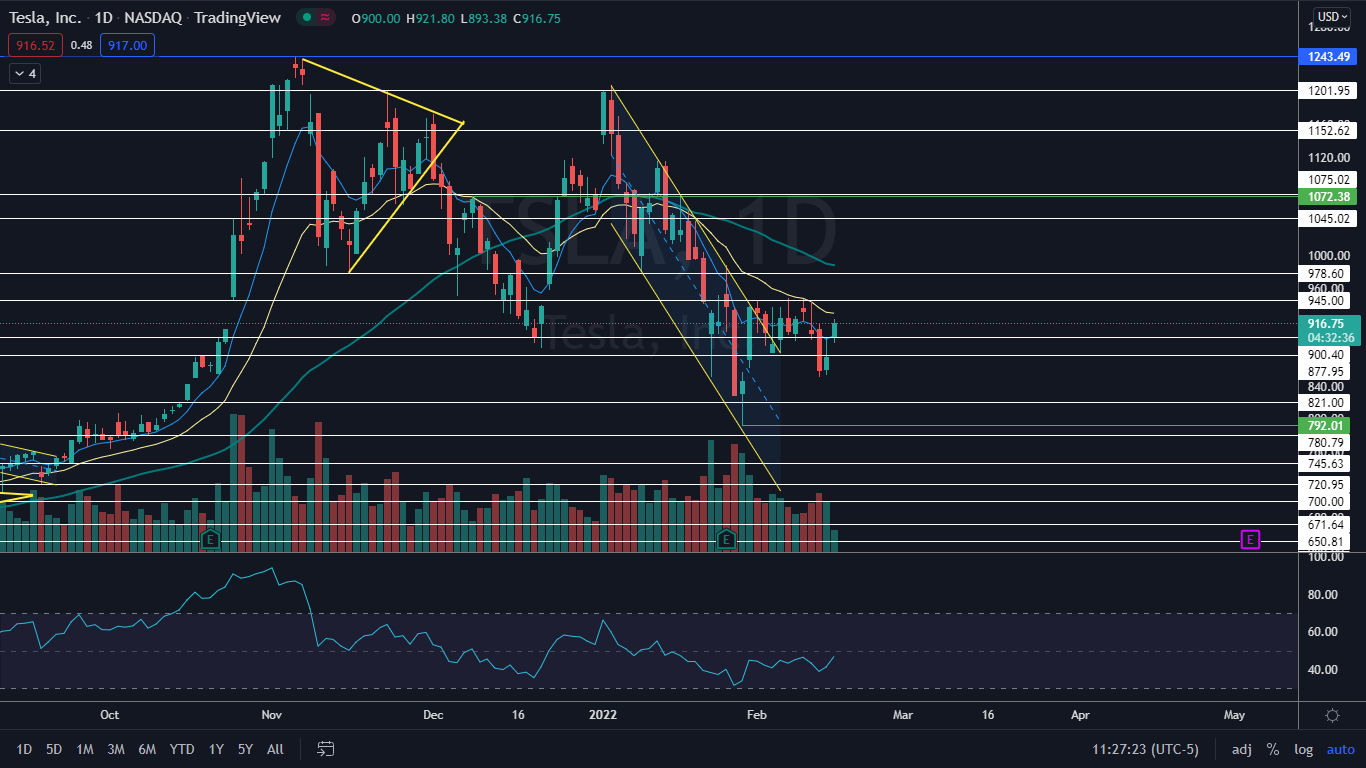
The Tesla Chart: Tesla reversed course into an uptrend on Jan. 28 but negated it on Feb. 11, when the stock dropped below the Feb. 3 higher low set at $880.52. Tesla is now trading in a sideways consolidation pattern.
- On Tuesday, Tesla regained the eight-day EMA as support, which is a good sign for the bulls but like Nio’s stock, Tesla is rejecting near the 21-day EMA.
- If Tesla closes the trading day near its high-of-day it will print a bullish kicker candlestick, which could indicate higher prices will come again on Wednesday. Bulls would like to see the stock rise above $947.77, which could indicate the break of the uptrend was a bear trap.
- Tesla has resistance above at $945 and $978.60 and support below at $900.40 and $877.95.


