Lululemon Athletica, Inc (NASDAQ:LULU) and Nike, Inc (NYSE:NKE) have both fallen significantly from their record all-time highs, with Lululemon trading down about 30% since Nov. 16 and Nike losing about 20% of its value since Nov. 5.
However, the bottom may be in for the stocks, because on Jan. 24 Lululemon and Nike both hit a support level, bounced up from it and reversed course to the upside.
On Jan. 29, Lululemon broke up bullishly from a falling channel, which Benzinga called out the day prior, and has now consolidated into a bull flag pattern, which may provide a solid entry point for a trader. Similarly, Nike has confirmed a trend change, with a possible entry point off a higher low being provided on Wednesday.
Both stocks look to have room for more upside, but profit could be made more quickly in Lululemon because a bull flag is a more powerful short-term chart pattern than an uptrend.
It should be noted, however, that events affecting the general markets, negative or positive reactions to earnings prints and news headlines about a stock can quickly invalidate patterns and break-outs. As the saying goes, ‘the trend is your friend until it isn’t’ and any trader in a position should have a clear stop in place and manage their risk versus reward.
See Also: 21 Stocks Moving in Wednesday’s Pre-Market Session
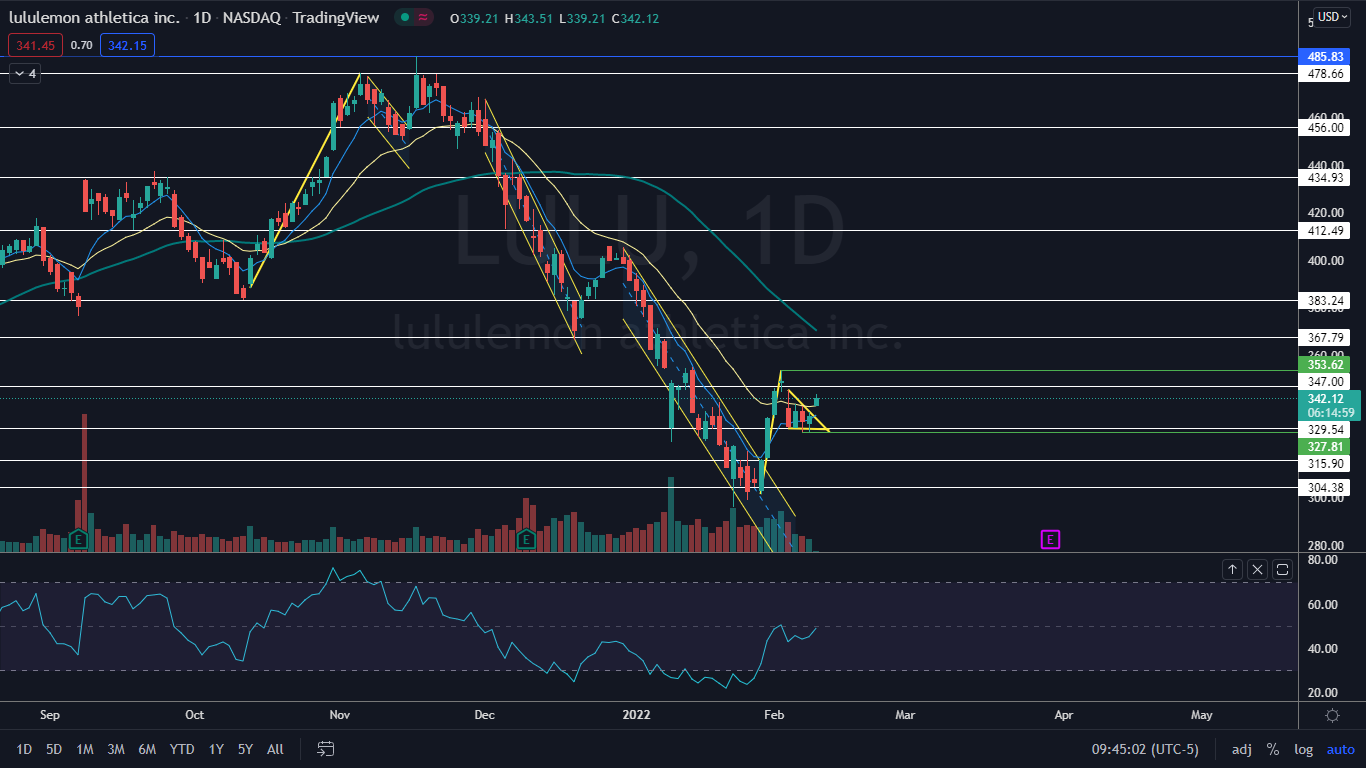
The Lululemon Chart: On Wednesday, Lululemon gapped up slightly higher and looked to be breaking up from the bull flag pattern on higher-than-average volume on lower timeframes. The pole of the pattern was formed between Jan. 28 and Feb. 2 and the flag was created between Feb. 3 and Tuesday.
- The measured move of the bull flag, if it continues to be recognized, is about 16%, which indicates Lululemon could trade up toward the $382 level in the future.
- The gap up open allowed Lululemon to regain the 21-day exponential moving average (EMA) as support and if the stock is able to continue trading above the area for a period of time the eight-day EMA will eventually cross above the 21-day, which would give bulls more confidence going forward.
- Bulls want to see Lululemon pop up over the Feb. 2 high of $353.62, which would confirm the stock is trading in an uptrend. The most recent higher low falls at the $327.81 mark, which would be an ideal place to place a stop for traders already in a position.
- Lululemon has resistance above at $347 and $367.79 and support below at $329.54 and $315.90.
Want direct analysis? Find me in the BZ Pro lounge! Click here for a free trial.

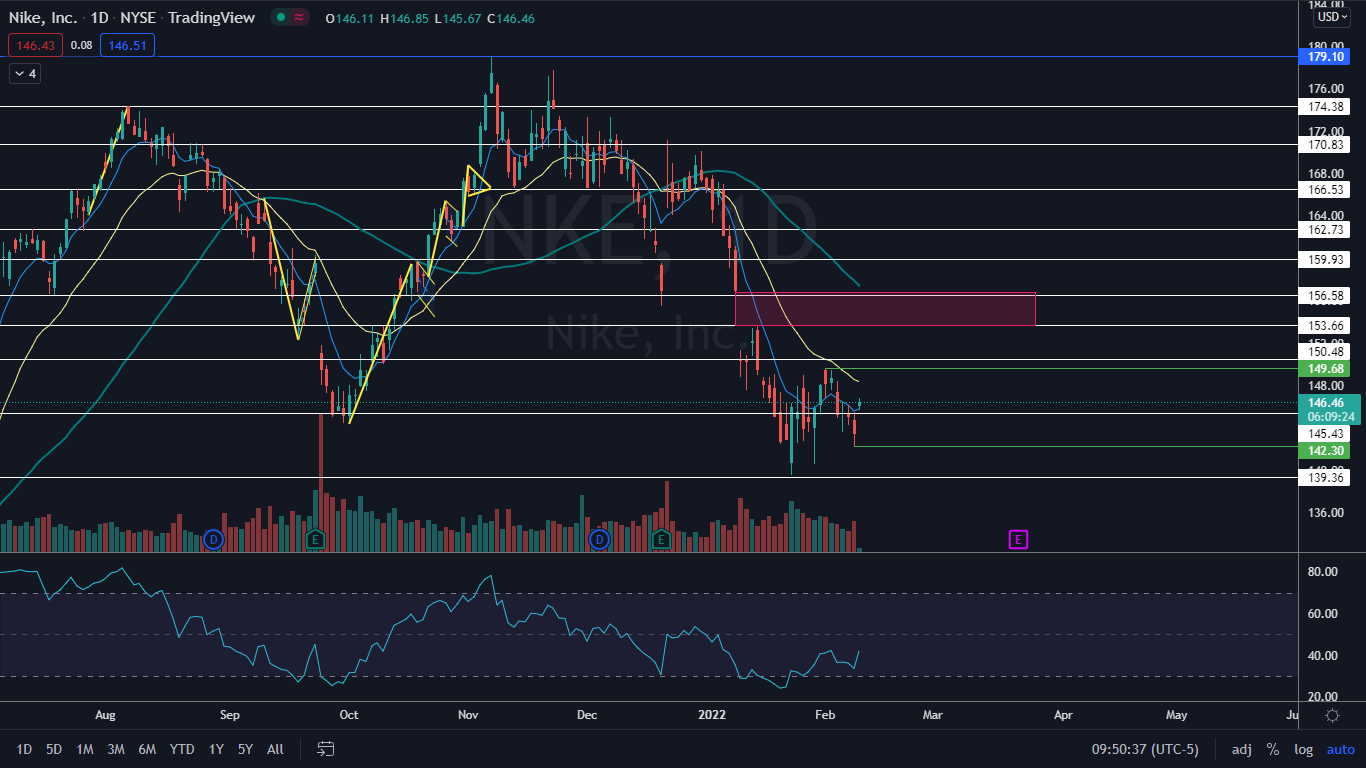
The Nike Chart: Nike has been trading in an uptrend since Jan. 24 and on Wednesday looks to have printed its next higher low at the $142.30 mark. The stock will need to rise up over $149.68 in the coming days to print its next higher high and confirm the trend is still intact.
- On Wednesday, Nike gapped up slightly higher, which caused the stock to regain the eight-day EMA as support. If Nike is able to print another higher high, it will regain the 21-day EMA, which would be bullish.
- Nike has a gap above on its chart between $153.60 and $156.86. Gaps on charts fill about 90% of the time, so it is likely the stock will trade up to fill the range in the future.
- Nike has resistance above at $150.48 and $153.66 and support below at $145.43 and $139.36.


