Target (TGT) stock is inching higher on Tuesday’s trading, up about 3% at last check as it climbs on earnings.
The company reported its fourth-quarter earnings before the open and at first, Wall Street really didn’t know what to make of it.
Immediately after the report, shares were down more than 5%. Then a few minutes later they were up almost 6%. Finally, the stock opened higher by just 1%.
The retailer easily topped analysts’ earnings expectations for the quarter, while also edging past revenue estimates. That said, earnings were down 40% year over year.
Worse, Target’s first-quarter and full-year earnings outlooks were quite low vs. consensus estimates.
Target joins Walmart (WMT) and Home Depot (HD) in providing conservative outlooks, but the reaction is far from the bearish beat-down that we saw in these names several quarters ago when they reported disappointing results.
Trading Target Stock on Earnings

Chart courtesy of TrendSpider.com
I’m going to be honest, the quarter was fine but the outlook was pretty disappointing. When trading, it’s nice to have conviction and the lack of “fundamental follow-through” does create some concerns on the longevity of a potential rally here, even if the stock is rallying on the results on Tuesday.
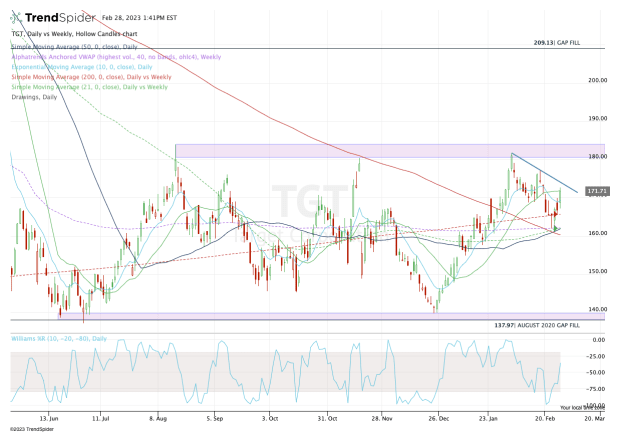
When we zoom out, it’s clear that Target stock has been stuck between $140 on the downside and $180 on the upside.
A few weeks ago, shares were charging higher and were trading above all of the daily moving averages.
After the recent pullback though, Target stock is trying to regain the 10-day and 21-day moving averages. It’s not unlike the post-earnings reaction we’re seeing with Zoom Video (ZM), despite the two stocks being in completely different industries.
To see a post-earnings rally is positive for the bulls.
One concern I would have is the recent series of lower highs. While one could argue this is simply consolidation, it’s hard not to notice each rally since the February high has stalled at the 61.8% retracement (just as today’s rally is doing).
Make it simple.
Back above the 10-day and 21-day moving averages along with downtrend resistance puts $180-plus back in play, with the potential for a much larger breakout.
On the downside, a break of $160 puts Target stock below far too many measures to mention here. But suffice to say, a close below this level could open up the stock’s potential decline back down to the $140s.


