Ford Motor Co (NYSE:F) gapped up slightly higher to start the trading day on Friday, in tandem with the general market that saw the S&P 500 rising over 1%.
The automaker has soared about 10% over the last three trading days, possibly in reaction to a double bottom pattern the stock formed on the daily chart.
A double bottom pattern is a reversal indicator that shows a stock has dropped to a key support level, rebounded, back tested the level as support and is likely to rebound again. It's possible the stock may retest the level as support again creating a triple bottom or even quadruple bottom pattern.
The formation is always identified after a security has dropped in price and is at the bottom of a downtrend whereas a bearish double top pattern is always found in an uptrend. A spike in volume confirms the double bottom pattern was recognized and subsequent increasing volume may indicate the stock will reverse into an uptrend.
- Aggressive bullish traders may choose to take a position when the stock’s volume spikes after the second retest of the support level. Conservative bullish traders may wait to take a position when the stock’s share price has surpassed the level of the initial rebound (the high before the second bounce from the support level).
- Bearish traders may choose to open a short position if the stock rejects at the level of the first rebound or if the stock falls beneath the key support level it created the double bottom pattern at.
Want direct analysis? Find me in the BZ Pro lounge! Click here for a free trial.
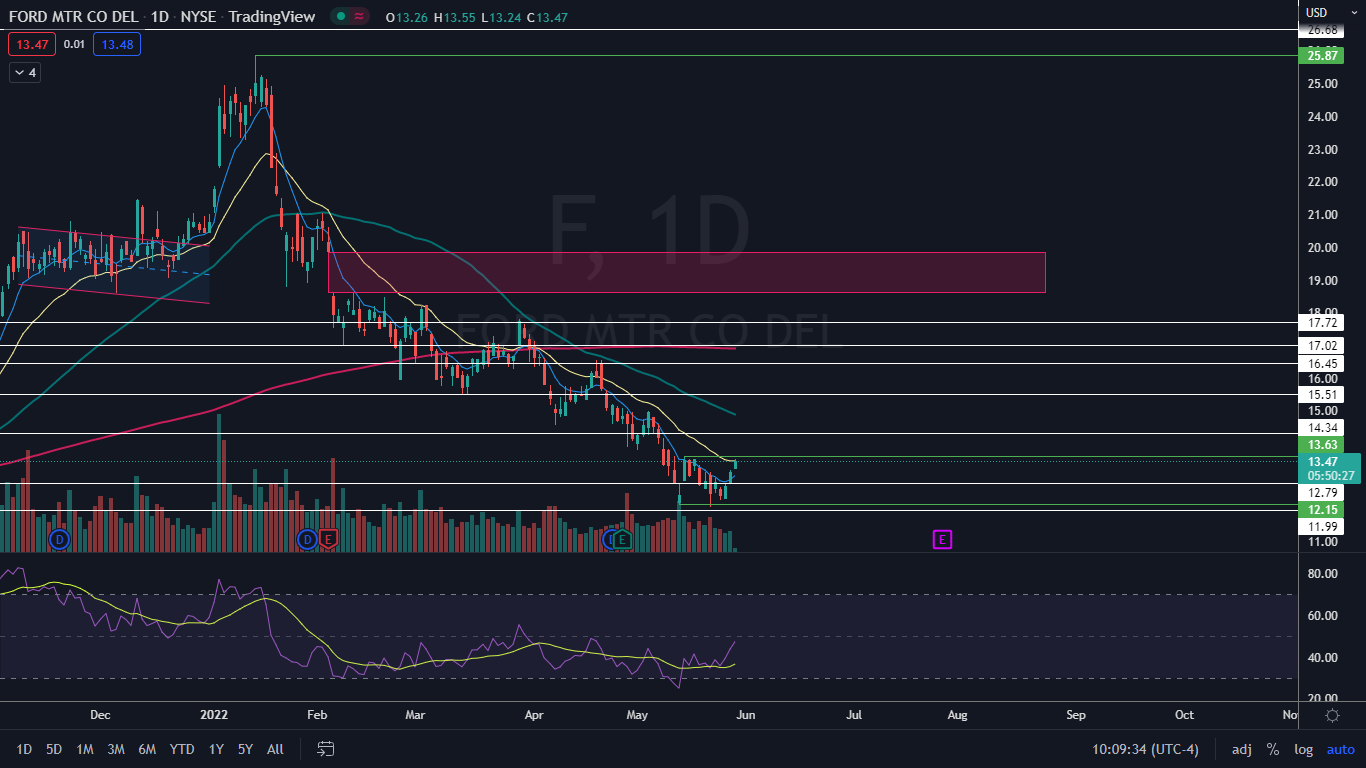
The Ford Chart: Ford created a double bottom pattern on May 12 and May 20 near the $12.15 level and on May 24 and May 25, the stock came near to that area again and bounced, causing the stock to soar higher. The price action near the $12.30 mark on May 24 and May 25 caused the stock to print a higher low, which may indicate a trend change is on the horizon.
- Ford has been trading in a steep and consistent downtrend since March 20, making a series of lower highs and lower lows. Although the stock has printed a higher low, in order for Ford to confirm a new uptrend is beginning it will need to rise up above the most recent lower high, which was printed on May 13 and $13.63.
- On Thursday, Ford regained the eight-day exponential moving average (EMA) as support and on Friday, the stock was attempting to regain the 21-day EMA. Bullish traders will ideally want to see Ford close the trading day above the 21-day EMA and if the stock can remain trading above the indicator for a period of time, the eight-day EMA will cross above the 21-day, which would give bulls more confidence going forward.
- Ford has resistance above at $14.34 and $15.51 and support below at $12.79 and $11.99.