AMC Entertainment (AMC) leaped out of the gate on May 31, the first trading day of a holiday-shortened week.
The shares moved up as much as 11% to start the week, then eased to 4.6% at last check.
The initial rally came after a record Memorial Day box office result for 'Top Gun: Maverick.’
AMC said that domestically and internationally more than 5 million customers came through the doors this weekend. Two-thirds of those visitors came for the new "Top Gun" film.
AMC Entertainment has been trading much better lately. The stock is working on its third straight daily gain, and if it closes higher this week, it will mark its third straight weekly gain.
Despite the trouble that the overall market has had over the past two months, the so-called meme stocks like AMC Entertainment and GameStop (GME) lately have been finding some momentum.
That’s not to say these stocks haven’t been hit in the stock market selloff. AMC shares are still down almost 60% from the March high and down 46% on the year.
Does it have more upside right now?
Trading AMC Entertainment Stock
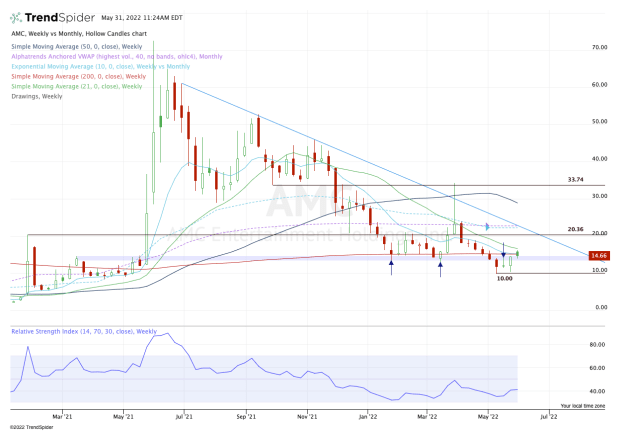
Chart courtesy of TrendSpider.com
The $13.50 to $15 area really has my attention. Not only do the 10-week and 200-week moving averages sit just above this area, but the zone is also a prior support area from the first quarter that has been resistance until this week.
The bulls now hope that AMC Entertainment stock can reclaim this area and continue higher. If it can do that, it could unlock significant upside levels.
Specifically, I’m looking to see whether AMC can clear the 21-week moving average. That was resistance in March and sits just above today’s high.
Above that could open the door to $20, which would represent 37% upside from current levels. If AMC stock gains even more momentum, perhaps the bulls can turn their attention to the $22.50 to $23 area.
In that zone, we find the 10-month moving average and monthly VWAP measure. It’s also where downtrend resistance comes into play (blue line).
On the flip side, keep an eye on today’s current low at $13.93. A break of this level puts $13.50 in play — remember, that’s the bottom of the $13.50 to $15 range we’re watching.
A close below $13.50 could put $12 in play, followed by the $10 to $10.50 zone.