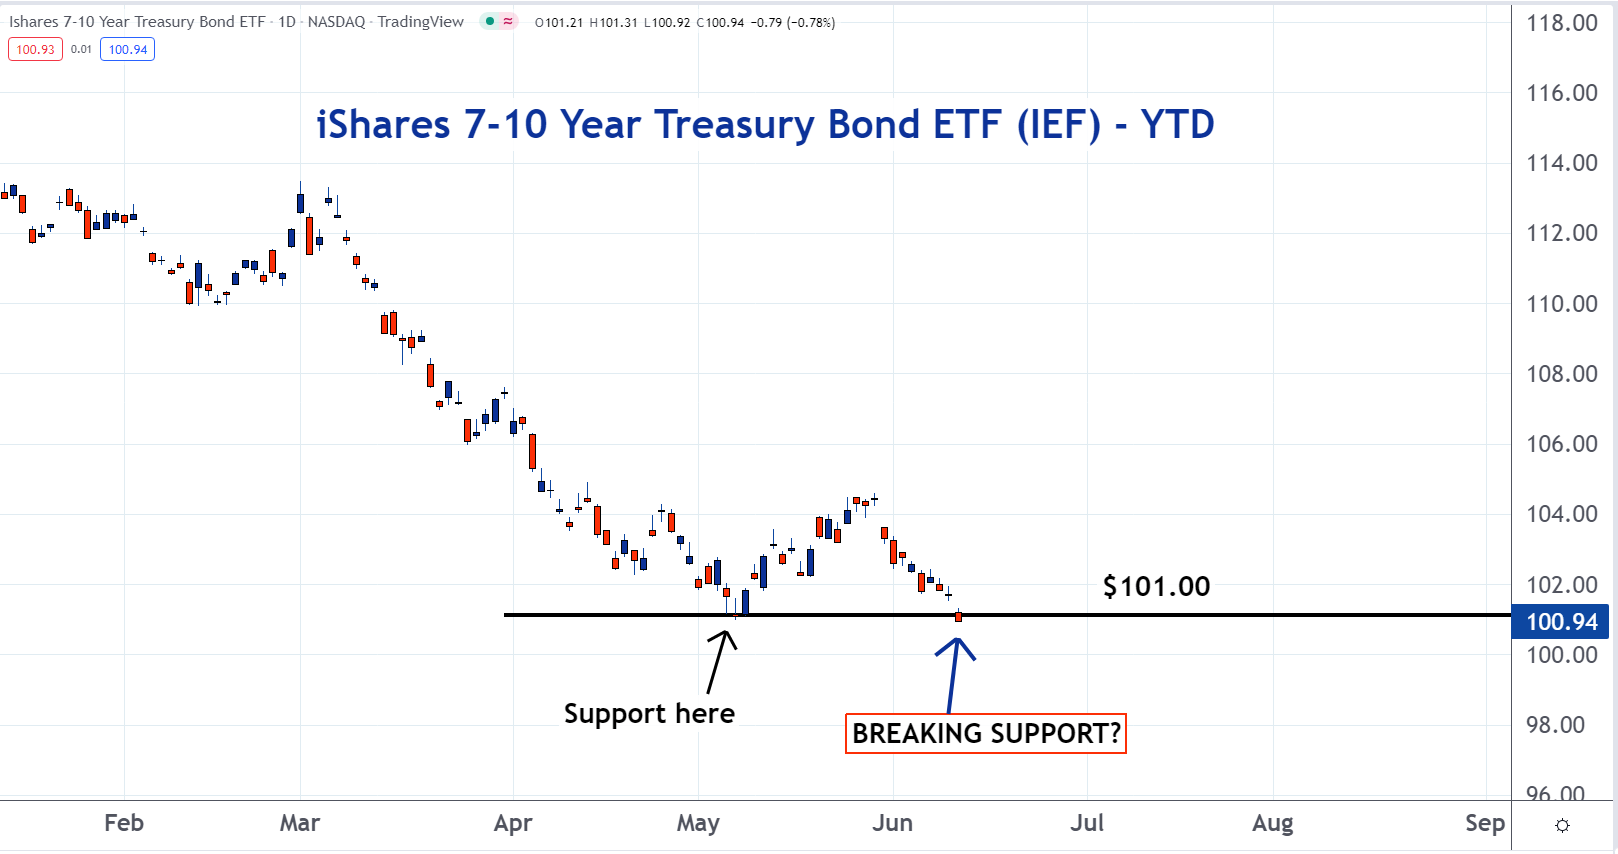
Things may be about to get even worse in the bond market. As you can see on the following chart, the iShares 7-10 Year Treasury Bond ETF (NASDAQ:IEF), which tracks the price of U.S. Treasury bonds, appears to be breaking support around the important $101 level.
Support is a large group of investors who are trying to buy shares at, or close to, the same price. But if the price drops below support, it could illustrate a bearish dynamic. It shows that the buyers who created the support have either finished or canceled their orders.
With this large amount of demand off of the market, sellers will be forced to accept lower prices. This could cause a new downtrend to form.
To learn more about trading, check out the new Benzinga Trading School.


