The semiconductor trade has been a hot one, but Intel (INTC) has lagged some of its key competitors.
Once the king of computer chips, Intel has taken a back seat to companies like Nvidia (NVDA) and Advanced Micro Devices (AMD), both of which have soared on their artificial-intelligence aspirations.
Intel stock has seen a peak-to-trough decline of 64.5%.
Don't Miss: Alibaba CEO Steps Down; Buy the Dip in the Stock?
While the shares have rallied 32% off the lows, its $134 billion market cap lags that of both its key competitors, as well as that of other chip stocks like Texas Instruments (TXN) and Broadcom (AVGO). We have taken note that Broadcom has traded well lately.
Intel stock had been enjoying a solid rally — 38% from its May 25 low to its June 20 high a few days ago — the shares have again unraveled.
The stock fell 11.5% from this week’s high to Wednesday’s low. At last check Intel was trading 1.6% lower.
Is it an opportunity for the bulls? Let’s look at the charts.
Buy the Dip on Intel Stock?
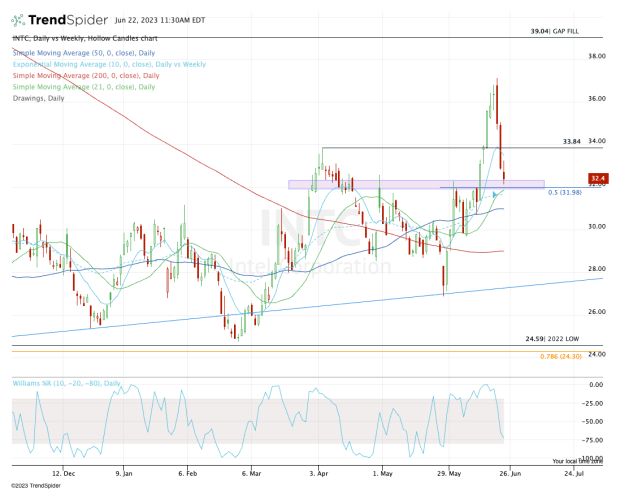
Chart courtesy of TrendSpider.com
To be honest, the setup in AMD we outlined a few days ago looks a bit more attractive, given that AMD has shown more relative strength than Intel. That’s as Advanced Micro tests into the gap-fill area and the 10-week moving average.
For Intel, though, the setup isn’t all that bad.
Ideally, the stock would have held its pullback into the $33.50 to $34 area, where it found its rising 10-day moving average and the high from April.
But that area is not holding. Instead, Intel stock is trading down into the mid-$32 region.
There it finds the 21-day and 10-week moving averages, the 50% retracement and prior resistance. For longs, this is a better entry point: Sellers might well be exhausted and these measures are generally stronger than the ones outlined above.
Don't Miss: Charting a Course: How to Trade Royal Caribbean and Carnival
From here, a rebound back to the 10-day moving average and $34 area will give traders a sense of how strong the bounce is. If it reclaims these measures, $35-plus is in play.
On the downside, a continued breakdown could put the 50-day moving average and the 61.8% retracement in play near $31, but below that and things get pretty sloppy for the bulls.
The bottom line: Let’s see if the $32 area can hold as support.
Get investment guidance from trusted portfolio managers without the management fees. Sign up for Action Alerts PLUS now.