Shares of Microsoft (MSFT) have not traded all that well lately, down in two straight weeks and struggling to rally on Monday.
That said, the stock is still riding a rather impressive upward move off the January low. Microsoft bottomed on Jan. 26 and then rallied more than 26% while stringing together a five-week winning streak.
When ChatGPT exploded onto the scene, Microsoft pounced as it dumped a multibillion-dollar investment into the platform’s parent, OpenAI.
That’s as Microsoft is trying to bolster its search and browser game against Alphabet’s (GOOGL) (GOOG) Google and Chrome products.
For what it’s worth, that strategy seems to be working — at least in regards to the stock price. Alphabet stock has been under significant pressure, most of which has come after an embarrassing AI-related mistake.
As for Microsoft, let’s take another look at the charts.
Trading Microsoft Stock

Chart courtesy of TrendSpider.com
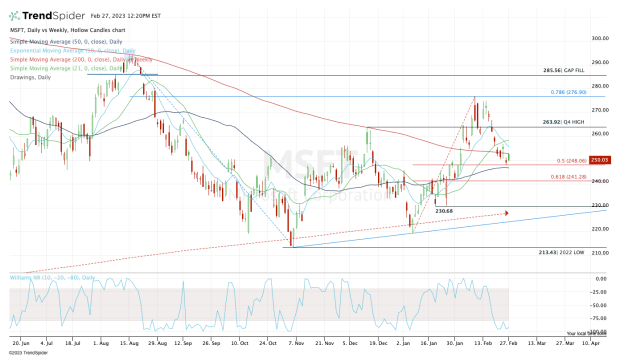
After a powerful rally that sent Microsoft stock back above all its daily moving averages and the fourth-quarter high, the pullback has been abrupt.
For traders, they must be willing to pivot quickly when the setup changes. In the case of Microsoft, that came on Thursday, Feb. 16, when the stock closed below the fourth-quarter high and the 10-day moving average.
It meant that the short-term trend had broken and that the shares were back below a key level. If the stock had reclaimed these measures, the bulls could have made a case to be long. But that scenario didn't play out as Microsoft continued to weaken.
The stock has now retraced half the rally and tries to hold the 50-day moving average and the 50% retracement.
If it can hold this zone, let’s see whether it can regain its 10-day and 21-day moving averages, opening the door to the $262.50 to $265 zone. Above that and $275 could be in the cards again.
On the downside, a break of the 50-day moving average near $255 could open the door all the way down to the low-$240s, where Microsoft stock finds the 61.8% retracement.
I don’t know that we’ll see it, but a dip down to the $230 area would be very attractive for long-term buyers. There we find the 200-week moving average and uptrend support, along with the 2023 lows.


