Warren Buffett’s Berkshire Hathaway (BRK.A) (BRK.B) shares have been trading really well and are breaking out.
Coming into Wednesday’s trading session, the stock had closed higher in nine straight trading sessions. Further, the shares are up in each of the past four weeks.
That’s as names like Apple (AAPL), bank stocks and defensive names continue to plow higher. For investors unaware, defensive stocks have enjoyed a quiet but strong rally over the past several weeks.
Don't Miss: Boeing Stock Faces Overhead Resistance as It Tries to Take Flight
Apple has been a leader so far this year — up about 20% in 2023 — and is Buffett’s largest public position, while the banks have had a mostly bullish post-earnings response so far.
All these factors have led to a breakout in Berkshire Hathaway stock.
Let’s take a look at the Class B stock — BRK.B — and see if more gains could be on the way.
Trading Warren Buffett’s Berkshire Hathaway Stock
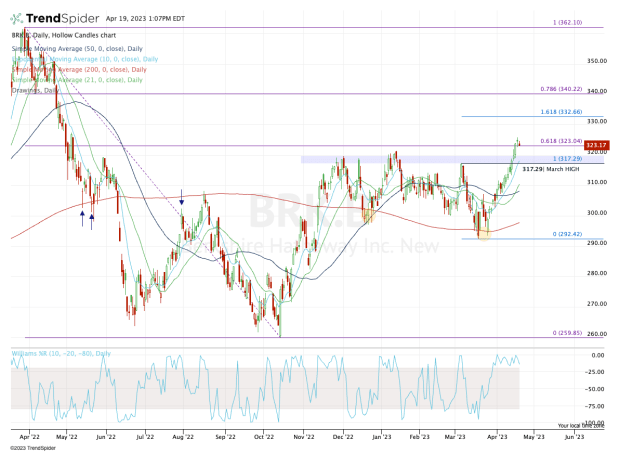
Chart courtesy of TrendSpider.com
The $317 to $320 area has been stiff resistance for Berkshire Hathaway stock.
In early March the shares made a quick sprint to this level but failed to break out. Instead, they rolled over to multimonth lows, eventually finding support in the mid-$290s near the 200-day moving average.
With the stock having recently traded as high as $325.72, the bulls are looking for a dip to buy.
I’d love to see the stock find support at former resistance, in the $317 to $320 area. On the plus side, Berkshire Hathaway stock would also find the rising 10-day moving average in this area.
If this buy-the-dip setup comes to fruition, it’s an excellent opportunity for the bulls.
If support fails here, active traders can bail on their positions with minimal damage and wait to see where stronger support materializes. If it holds, they should have an excellent cost basis to work with.
Don't Miss: Time to Buy Charles Schwab Stock? The Chart Acts as a Guide
On the upside, the shares need to push through the most recent high, near $325.75. Above that could open the door to the 161.8% extension up near $332.50. Ultimately, the larger upside target is the 78.6% retracement near $340.
The only difficult hurdle I see in the chart is the 61.8% retracement near $323. While Berkshire did break out over the $317 to $320 area — and even cleared the 61.8% retracement — it could still slow the rally down.
Nevertheless, the breakout over this stiff multiquarter resistance area is more significant to me than the 61.8%. That’s particularly true if the stock can stay above the breakout zone.
For now, keep an eye on the $317 to $320 area and see whether a pullback to this area is bought.
Action Alerts PLUS offers expert portfolio guidance to help you make informed investing decisions. Sign up now.