Boeing (BA) stock has been in the headlines a lot lately, and its recent rally surely is a factor.
At this week’s high, the stock was up 56% from the fourth-quarter low. Coming into this week, Boeing stock had rallied in eight of the past nine weeks. That included a stretch of six straight weekly gains.
The news flow helped as well.
About a month ago, optimism around the company’s 737 Max gave the stock a nice lift.
Then earlier this month, reports of a big order from United Airlines (UAL) for Boeing’s 787 Dreamliner helped give it a boost to multimonth highs.
After such a lofty rally, let’s take a look at the charts.
Trading Boeing Stock

Chart courtesy of TrendSpider.com
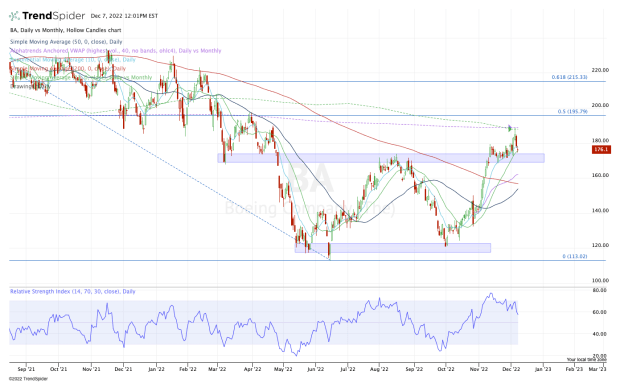
Boeing shares did a great job rallying out of the low-$120s. Amid a monstrous run, the stock actually pushed through stiff resistance in the $170 to $175 zone.
That area was support earlier in the year but clear resistance in the summer. After a slight pause in this zone, Boeing stock pushed through this area, then found it as support.
It’s a bullish development when a stock can reclaim current resistance and have that level turn into support.
For now, Boeing stock is pulling back into this area and finding support. So long as Boeing stock holds the 10-day and 21-day moving averages, as well as the $170 to $175 zone, then it’s hard to be overly bearish.
But -- the price action here highlights what makes trading in a bear market so difficult.
Notice how Boeing stock has traded quite well over the past few months on the daily chart. Then notice the monthly overlap of the VWAP measure and the 21-month moving average. Both measures rejected Monday’s rally.
From here, aggressive bulls can look for support near current prices and a rally back up toward this week’s high near $188.
On the downside, a break of $173 is discouraging, but below $170 and the door could open down to the $155 to $160 area.
There we find the 50% retracement of the current rally, as well as the 50-day and 200-day moving averages and the daily VWAP measure.


