
Boeing Company (NYSE:BA), FuelCell Energy, Inc (NASDAQ:FCEL) and Sunrun, Inc (NASDAQ:RUN) are all trading higher in strong uptrends despite the S&P 500 trading in both a daily and weeky downtrend. An uptrend occurs when a stock consistently makes a series of higher highs and higher lows on the chart.
The higher highs indicate the bulls are in control, while the intermittent higher lows indicate consolidation periods. Traders can use moving averages to help identify an uptrend with rising lower timeframe moving averages (such as the eight- or 21-day exponential moving averages), which indicate the stock is in a steep shorter-term uptrend. Traders can also use rising longer-term moving averages (such as the 200-day simple moving average) as an indicator of a long-term uptrend.
A stock often signals when the higher high is in by printing a reversal candlestick such as a doji, bearish engulfing or hanging man candlestick. Likewise, the higher low could be signaled when a doji, morning star or hammer candlestick is printed. The higher highs and higher lows often take place at resistance and support levels.
In an uptrend, the "trend is your friend" until it’s not, and in an uptrend there are ways for both bullish and bearish traders to participate in the stock:
- Bullish traders who are already holding a position in a stock can feel confident the uptrend will continue unless the stock makes a lower low. Traders looking to take a position in a stock trading in an uptrend can usually find the safest entry on the higher low.
- Bearish traders can enter the trade on the higher high and exit on the pullback. These traders can also enter when the uptrend breaks and the stock makes a lower low, indicating a reversal into a downtrend may be in the cards.
- See Also: Could Boeing Be Set To Emerge As A Leading Defense Stock?
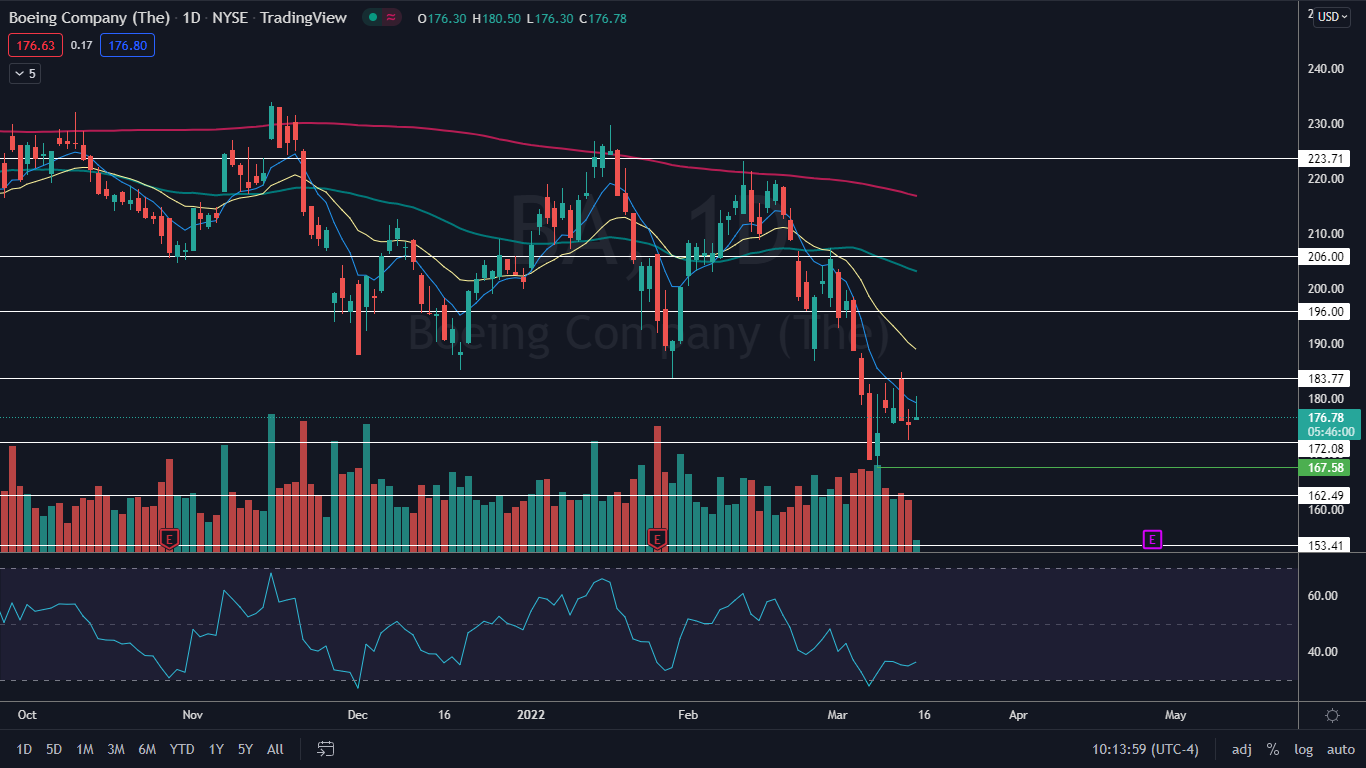
The Boeing Chart: Boeing appears to have reversed course into an uptrend when the stock bounced up from the $167.58 on March 8. Since that date, Boeing may have printed a higher low on Monday just above $172, but to confirm the uptrend, Boeing will need to print a higher high above the March 11 high of about $185 over the coming days.
On Tuesday, Boeing attempted to regain the eight-day exponential moving average (EMA) as support but rejected the level as resistance. Bullish traders will want to see the stock regain the level to feel more confident going forward.
Boeing has resistance above at $183.77 and $196 and support below at $172.08 and $162.49.
Want direct analysis? Find me in the BZ Pro lounge! Click here for a free trial.
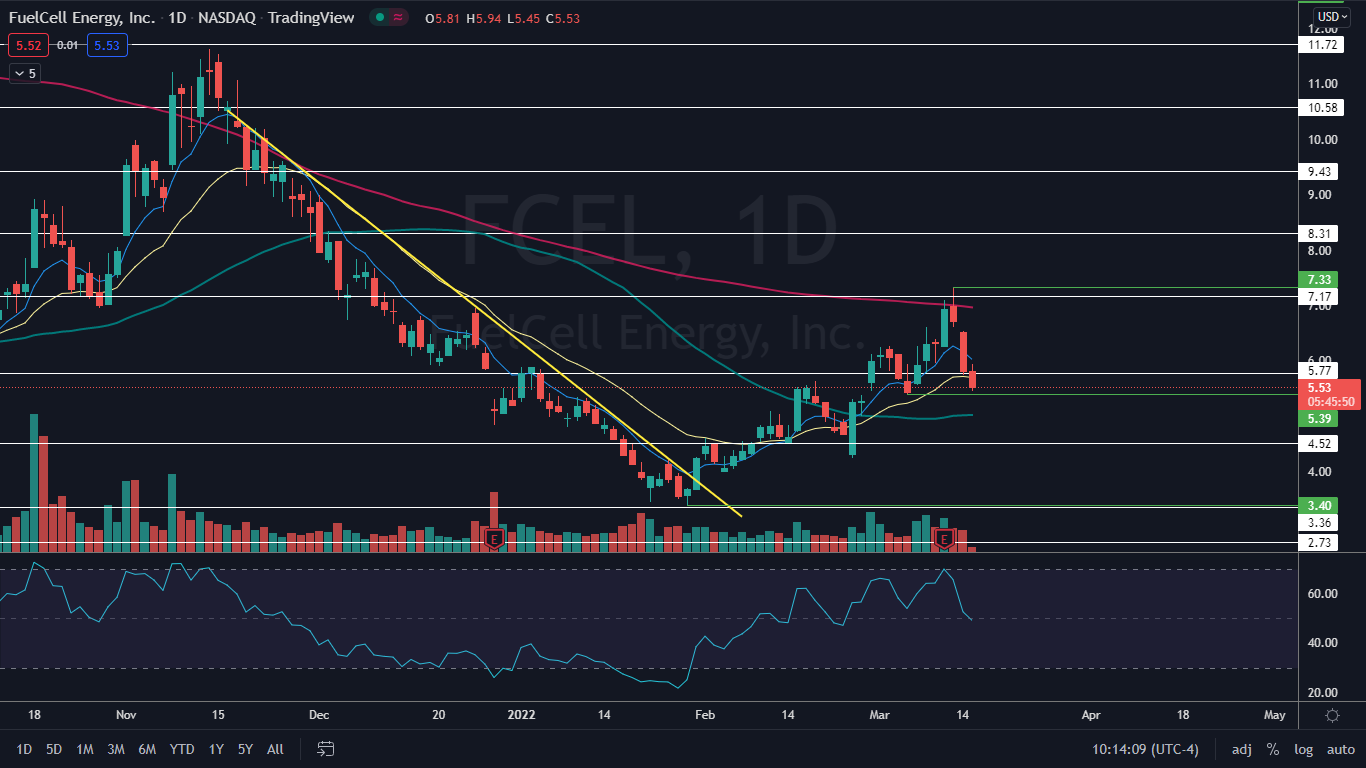
The higher low on FuelCell’s chart was needed to cool off the relative strength index, which was measuring in at over 70%, putting the stock into overbought territory.
FuelCell has resistance above at $5.77 and $7.17 and support below at $4.52 and $3.36.


.png?w=600)