By Lucas Montero, technical analyst at Finanflix
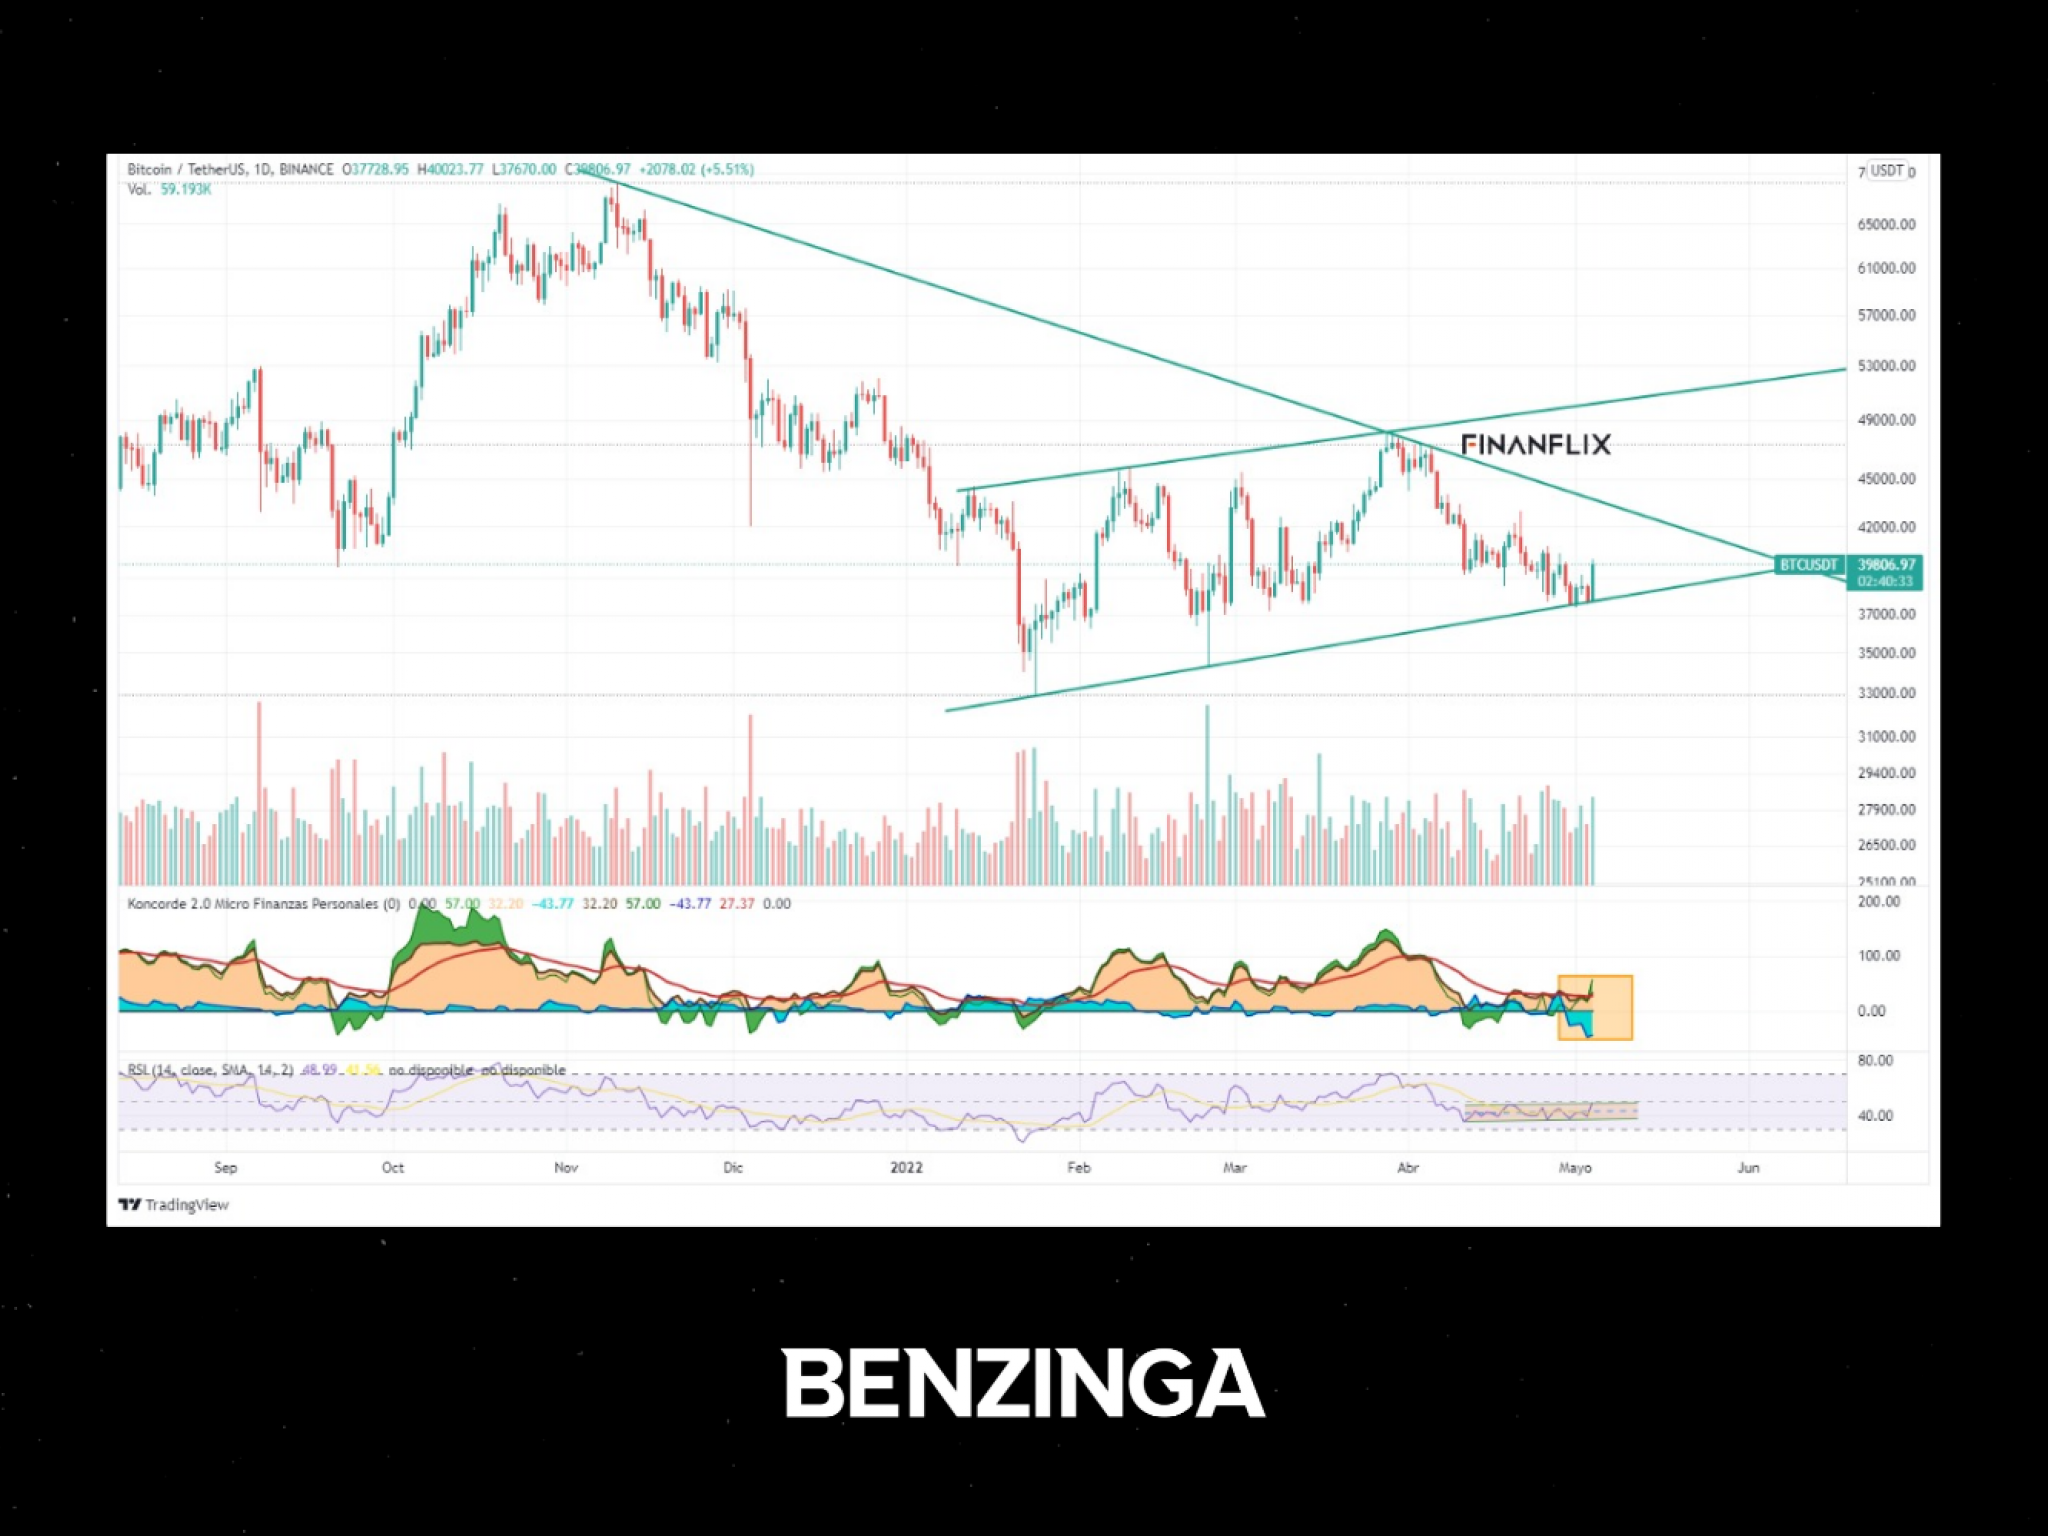
Bitcoin (CRYPTO: BTC) is showing a dynamic resistance since its all-time high at $68,789.63. Whenever this resistance was tested, the price dropped significantly.
Since January, Bitcoin has formed a lateral bullish channel in which it has been moving for more than three months, understanding the base of the channel as buy zones and the top of the channel as sell zones.
The Konkorde indicator — created by developer Xavier García (Blai5) — shows a significant outflow of institutional capital and the beginning of an inflow of retail investors, which can be interpreted as a bearish pattern.
The RSI is expressing something similar with a sideways movement in the area of 48 and 38 points and has been compressing sideways for a long time.
The increase in trading volume that recently occurred could be paving the path for a possible bullish rebound.
There are two relevant zones to think about a rebound: $42,400 and $43,675 (good times to take profits). And, in the event of losing the bullish channel, the $34,000 and $30,000 would be the relevant areas to speculate on possible bounces.

(Not Financial Advice, Do Your Own Research.)