What a ride it’s been in bitcoin and cryptocurrencies lately. The destabilization is not something that’s well understood by a lot of investors.
I’m not a cryptocurrency, blockchain or bitcoin expert either. I just follow the charts and the price action.
Coming into this week, the bitcoin bulls should have already been long gone from their positions, given that last month’s low and channel support had failed near $37,500.
Once that happened, it opened up the $33,000 area, then the key $29,000 to $30,000 zone. I earlier this week noted that the latter was a must-hold support level.
Crypto fortunes have been plummeting thanks to the recent correction in bitcoin prices. That’s particularly true for companies that own a lot of bitcoin, like Microstrategy (MSTR).
Given the events of the past few days, I wanted to take another look at bitcoin, which is up more than 15% from the recent low.
Trading Bitcoin
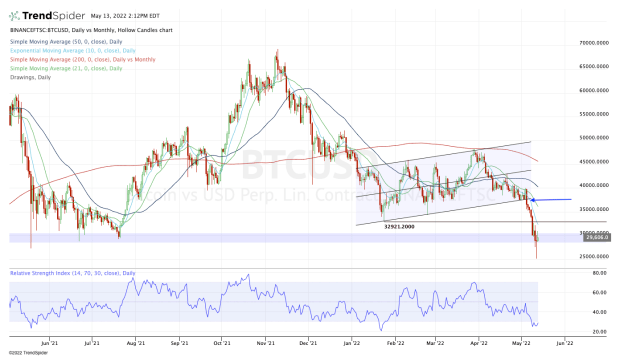
Chart courtesy of TrendSpider.com
Above is a daily look at bitcoin, while the below chart offers a weekly view.
The breakdown from initial support in the $37,500 area is quite clear. It cascades down through the $30,000 area, which you can see on both charts was a key support area last summer.
Now, it’s trying to recover this zone. If it can do that, then it opens the door back up to the $33,000 level. Above that level and $37,000-plus could be back in play.
But we’re not yet necessarily out of the woods.
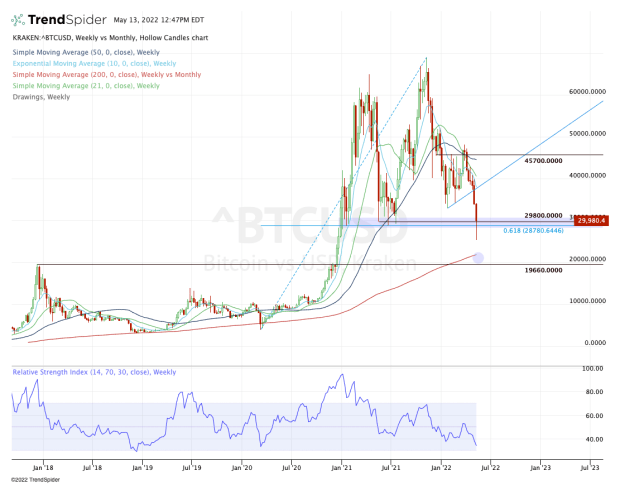
Chart courtesy of TrendSpider.com
The decline sent bitcoin down to a very key support area and the 61.8% retracement, as measured from the all-time high down to the March 2020 covid low. Seeing this area bend but not break — so far — is encouraging.
Nonetheless, it did fall far, hitting a low near $25,000.
Should bitcoin fail to recover $30,000 — or if it does reclaim it but fails to stay above it — this $25,000 area remains vulnerable to another retest.
If it fails as support, that technically opens the door down to the $19,500 to $22,000 zone. There we find the rising 200-month moving average and the prior all-time high from 2017.
As painful as it would be, a retest of this zone might well be an opportunity for the bulls, assuming bitcoin finds and keeps its footing.