AT&T, Inc (NYSE:T) gapped up and surged over 10% higher at one point Thursday after printing a third-quarter earnings beat.
For the third quarter, AT&T reported revenue of $29.64 billion, which beat the $29.56-billion consensus estimate. The company reported earnings per share of 68 cents, beating a consensus estimate of 61 cents. Wireless service revenues were up 5.6%, while broadband revenues were up 6.1% year-over-year.
The earnings beat caused AT&T competitor Verizon Communications, Inc (NYSE:VZ) to trade higher. Verizon is expected to print third-quarter earnings on Friday before the market open.
The reaction Verizon receives following its earnings print is likely to affect whether bullish momentum comes into AT&T again on Friday.
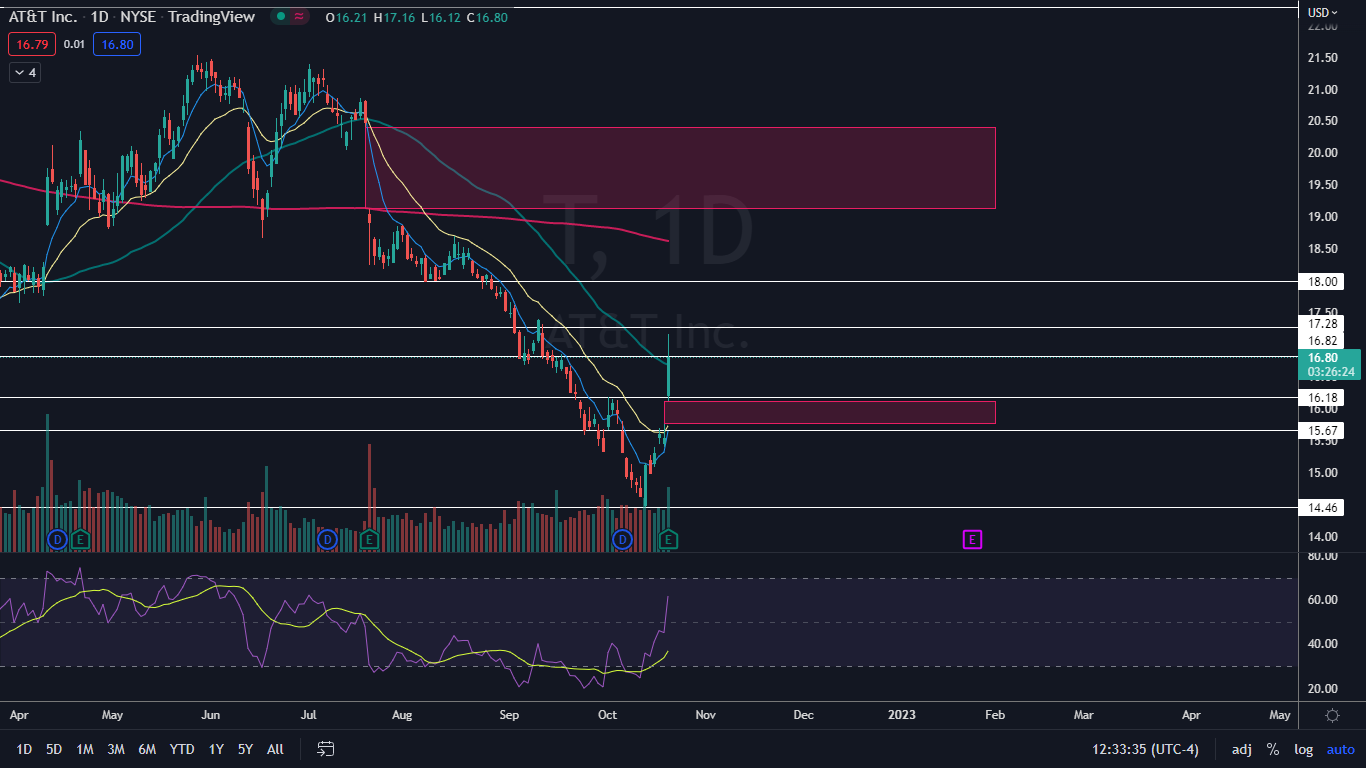
AT&T was surging on higher-than-average volume but struggling to regain the 50-day simple moving average (SMA) as support. The 50-day SMA often acts as heavy support and resistance in both directions, making it difficult for a stock to break through the area on the first attempt.
Want direct analysis? Find me in the BZ Pro lounge! Click here for a free trial.
The AT&T Chart: AT&T may need to consolidate near the 50-day SMA for a period of time, on smaller timeframes, to garner enough energy to break up above the level. If the stock is able to close above the 50-day SMA over the coming trading days, it will indicate longer-term sentiment has turned bullish.
- If AT&T continues to trend higher above the 50-day SMA on Friday, a period of consolidation is likely to come next week because the stock’s relative strength index (RSI) is likely to soar above the 70% mark. When a stock’s RSI reaches or pops above that level, it becomes overbought, which can be a sell signal for technical traders.
- Thursday’s surge caused AT&T to confirm a new uptrend has occurred because the stock has now printed a higher high above the most recent high of $15.70. Eventually AT&T will need to fall down to print a higher low, which may offer bullish traders who aren’t already in a position an entry point.
- When AT&T declines to print a higher low, traders can watch for a bullish reversal candlestick to form near the lower range of the gap, which exists between $15.76 and $16.12.
- AT&T has resistance above at $16.18 and $16.82 and support below at $15.67 and $14.46.

Photo via Shutterstock.


