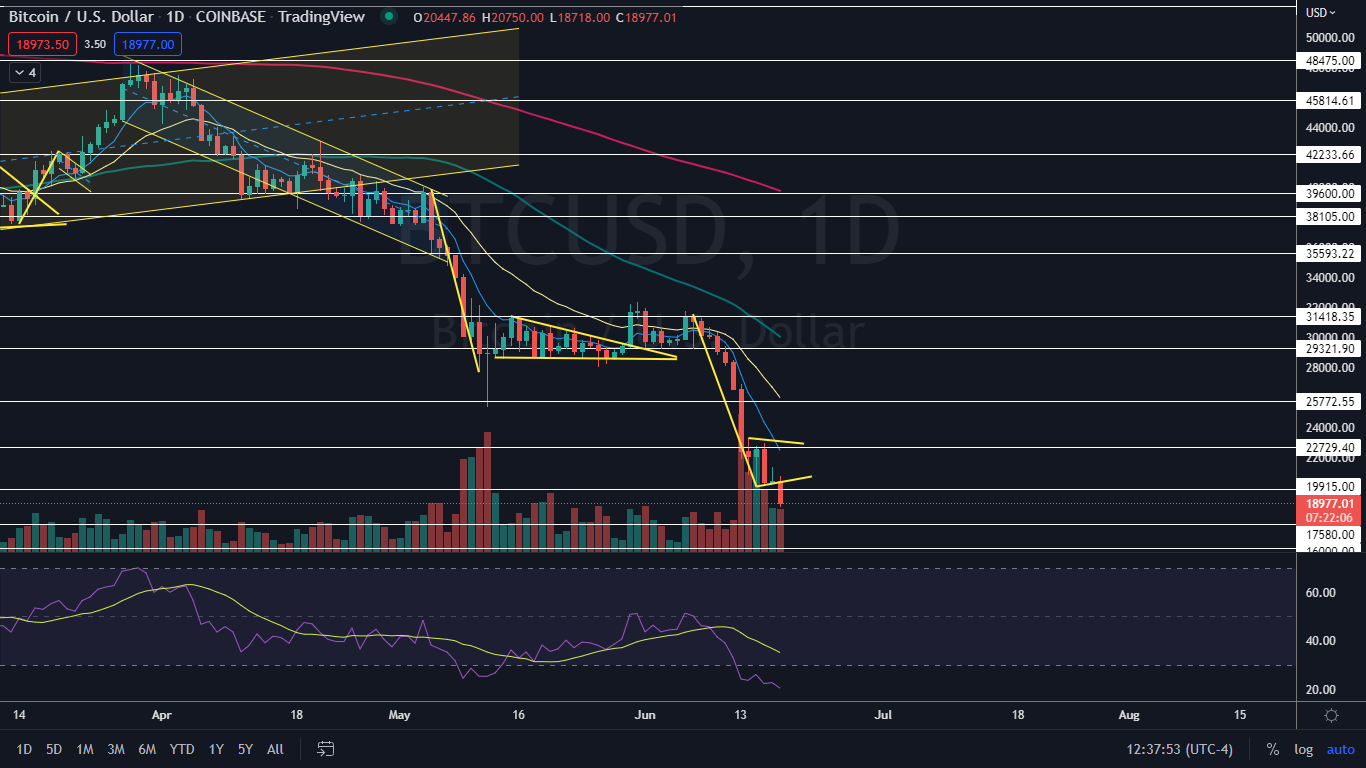
Bitcoin (CRYPTO: BTC) was plunging over 8% lower on Saturday, breaking down from a bear flag pattern Benzinga called out on Thursday.
The bear flag pattern suggests Bitcoin is heading toward the $15,500 mark on this leg down, because the measured move is about 33%. The measured move of a bear flag is calculated by taking the length of the pole as a percentage and subtracting it from the highest price within the flag formation.
The crypto is unlikely to head that low in one fell swoop, however, and it's more probable Bitcoin will bounce up along the way in order to at least print lower highs as the crypto continues lower in its downtrend.
Crypto winter looks to be in full swing, likely to last many more months if the last crypto winter, which occurred between the beginning of 2018 and mid-2020, is any indication. The harsh reality suggests this crypto winter could stick around for another two years, having only begun last November, when Bitcoin reached a new all-time high of $69,000.
On Saturday, Bitcoin plummeted below $19,915, which was the high of the last crypto bull cycle, which peaked in December 2017, spooking investors with the prospect that much lower prices could be on the horizon.
Want direct analysis? Find me in the BZ Pro lounge! Click here for a free trial.
The Bitcoin Chart: Bitcoin broke down through the bear flag pattern on higher-than-average volume on lower timeframes, which indicates the pattern was recognized by the algorithms. Although, the crypto is likely to bounce up over the coming days because the sudden drop brought Bitcoin’s relative strength index (RSI) down to 20%.
- When a stock or crypto’s RSI falls below the 30% level it becomes oversold, and when the RSI reaches 20% it’s considered severely oversold. Bitcoin’s RSI hasn’t dropped to the 20% level since Jan. 22, which was followed by a 35% increase in the crypto’s price over the month that followed.
- As of press time, Bitcoin’s volume on Coinbase was measuring in at about 25,000 compared to the 10-day average of 32,277. Although the 24-hour trading volume has not yet surpassed the average, there are still many hours to go before the timeframe closes and if the fear selling continues, Bitcoin will easily clock higher-than-average volume.
- If Bitcoin closes the trading session near its low-of-day price, the crypto will print a bearish Marubozu candlestick, which could indicate lower prices will come again over the next 24-hour period. The second most likely scenario in this case is that Bitcoin will print an inside bar pattern to consolidate.
- If the crypto is able to bounce up to close the trading session with a lower shadow, Bitcoin will print a hammer candlestick, which could indicate a further bounce to the upside is in the cards. Traders can then watch for the crypto to reject from the lower trendline of the bull flag pattern.
- Bitcoin has resistance above at $19,915 and the psychologically important $20,000 level and support below at $17,580 and $16,000.

See Also: So Will Bitcoin Fall Below $10K, Ethereum Below $500 And Dogecoin Below 3 Cents By The End Of July?


