Apple, Inc (NASDAQ:AAPL) was trading about 0.7% down in the premarket on Tuesday, dragging the S&P 500 about 0.12% lower.
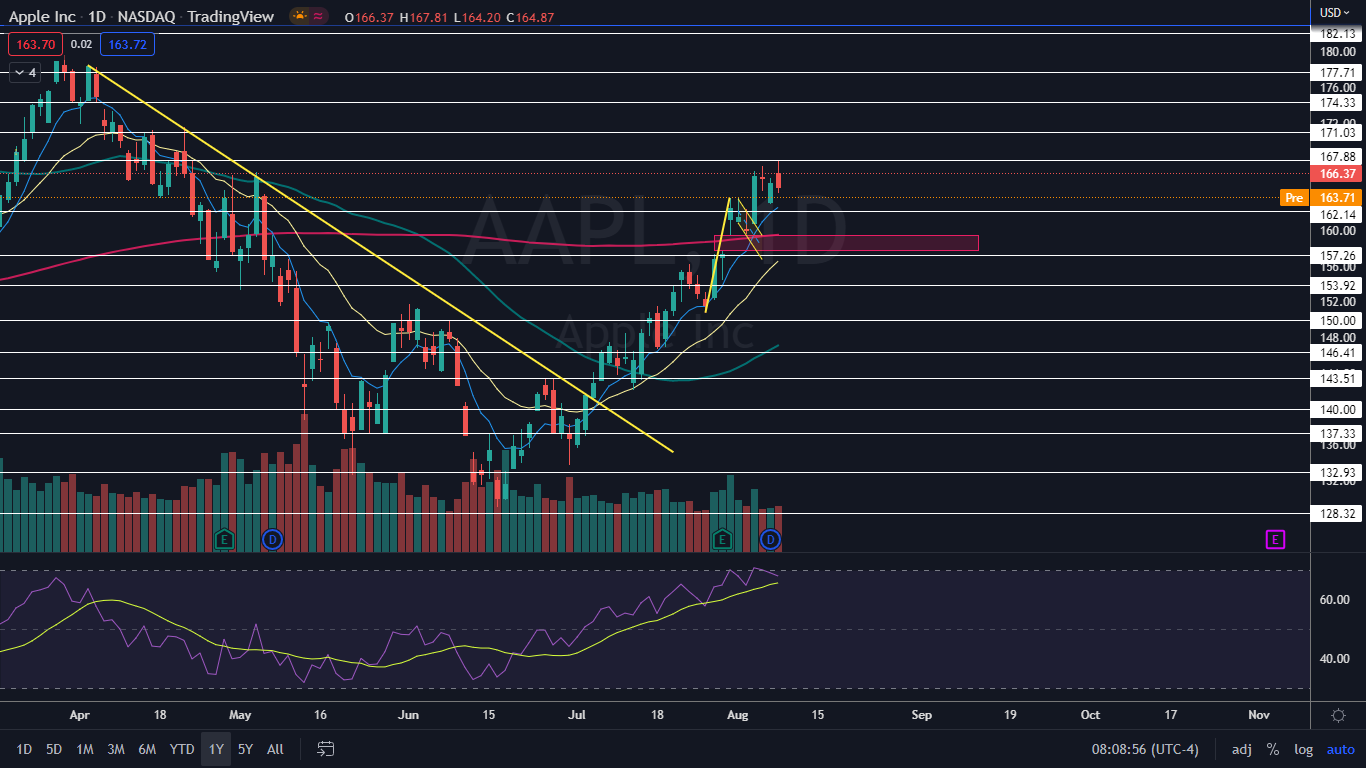
After breaking up bullishly from a bull flag pattern on Aug. 3 and rallying over 3%, Apple hit a heavy resistance zone at the $167.88 mark on Monday and closed that trading day down 0.9% off the open.
Apple likely had difficulty breaking through the resistance level on the first daily attempt because the stock has become extended, with Apple’s relative strength index (RSI) measuring in between 65% and 71% since July 28.
RSI is an indicator technical traders use to measure bullish and bearish price momentum. RSI levels can range between zero and 100, with levels between 30 and 70 generally considered to be healthy.
When a stock’s RSI falls below the 30% level, it's considered to be oversold. When a stock enters oversold territory, it indicates the security's price no longer reflects the asset's true value, which can signal a reversal to the upside is in the cards.
When a stock’s RSI rises above the 70% area, it is considered to be overbought. When a stock enters overbought territory, it signals the security's price is elevated to its intrinsic value, which can signal a reversal to the downside is on the horizon.
RSI is best used when combined with other signals and patterns on a stock chart because stocks can remain in oversold and overbought territory for an extended period of time before reversing.
Want direct analysis? Find me in the BZ Pro lounge! Click here for a free trial.
The Apple Chart: Apple’s extended RSI has likely made some bullish traders back away from purchasing shares and has acted as a warning for others to exit their positions. Apple, and the market in general, has been very bullish since June 17 and may be in need of a larger pullback soon or at least sideways trading to cool the RSI, which results in choppy markets that are difficult to trade.
- Another sign on Apple’s chart that may have traders feeling weary is the gap below that exists between $157.64 and $159.50. Gaps on charts fill about 90% of the time, which makes it likely Apple will fall to fill the gap at some point in the future. Some bullish traders may be waiting for Apple to retrace and print a bullish reversal candlestick above the lower range of the gap.
- Traders waiting for the gap to fill will want to see Apple fall intraday and then bounce up to close the trading session above the gap because the 200-day simple moving average (SMA) is trending above the empty trading range. If Apple were to close a trading session below the 200-day SMA, the bears could more easily take control.
- Apple is trading in an uptrend on the daily chart, with the most recent higher low printed on Friday at $163 and the most recent confirmed higher high formed at the $167.19 mark the day prior. Shorter-term bullish traders will want to see Apple hold above the eight-day exponential moving average when the stocks falls to print its next higher low.
- Apple has resistance above at $167.88 and $171.03 and support below at $162.14 and $157.26.

Photo via Shutterstock.


