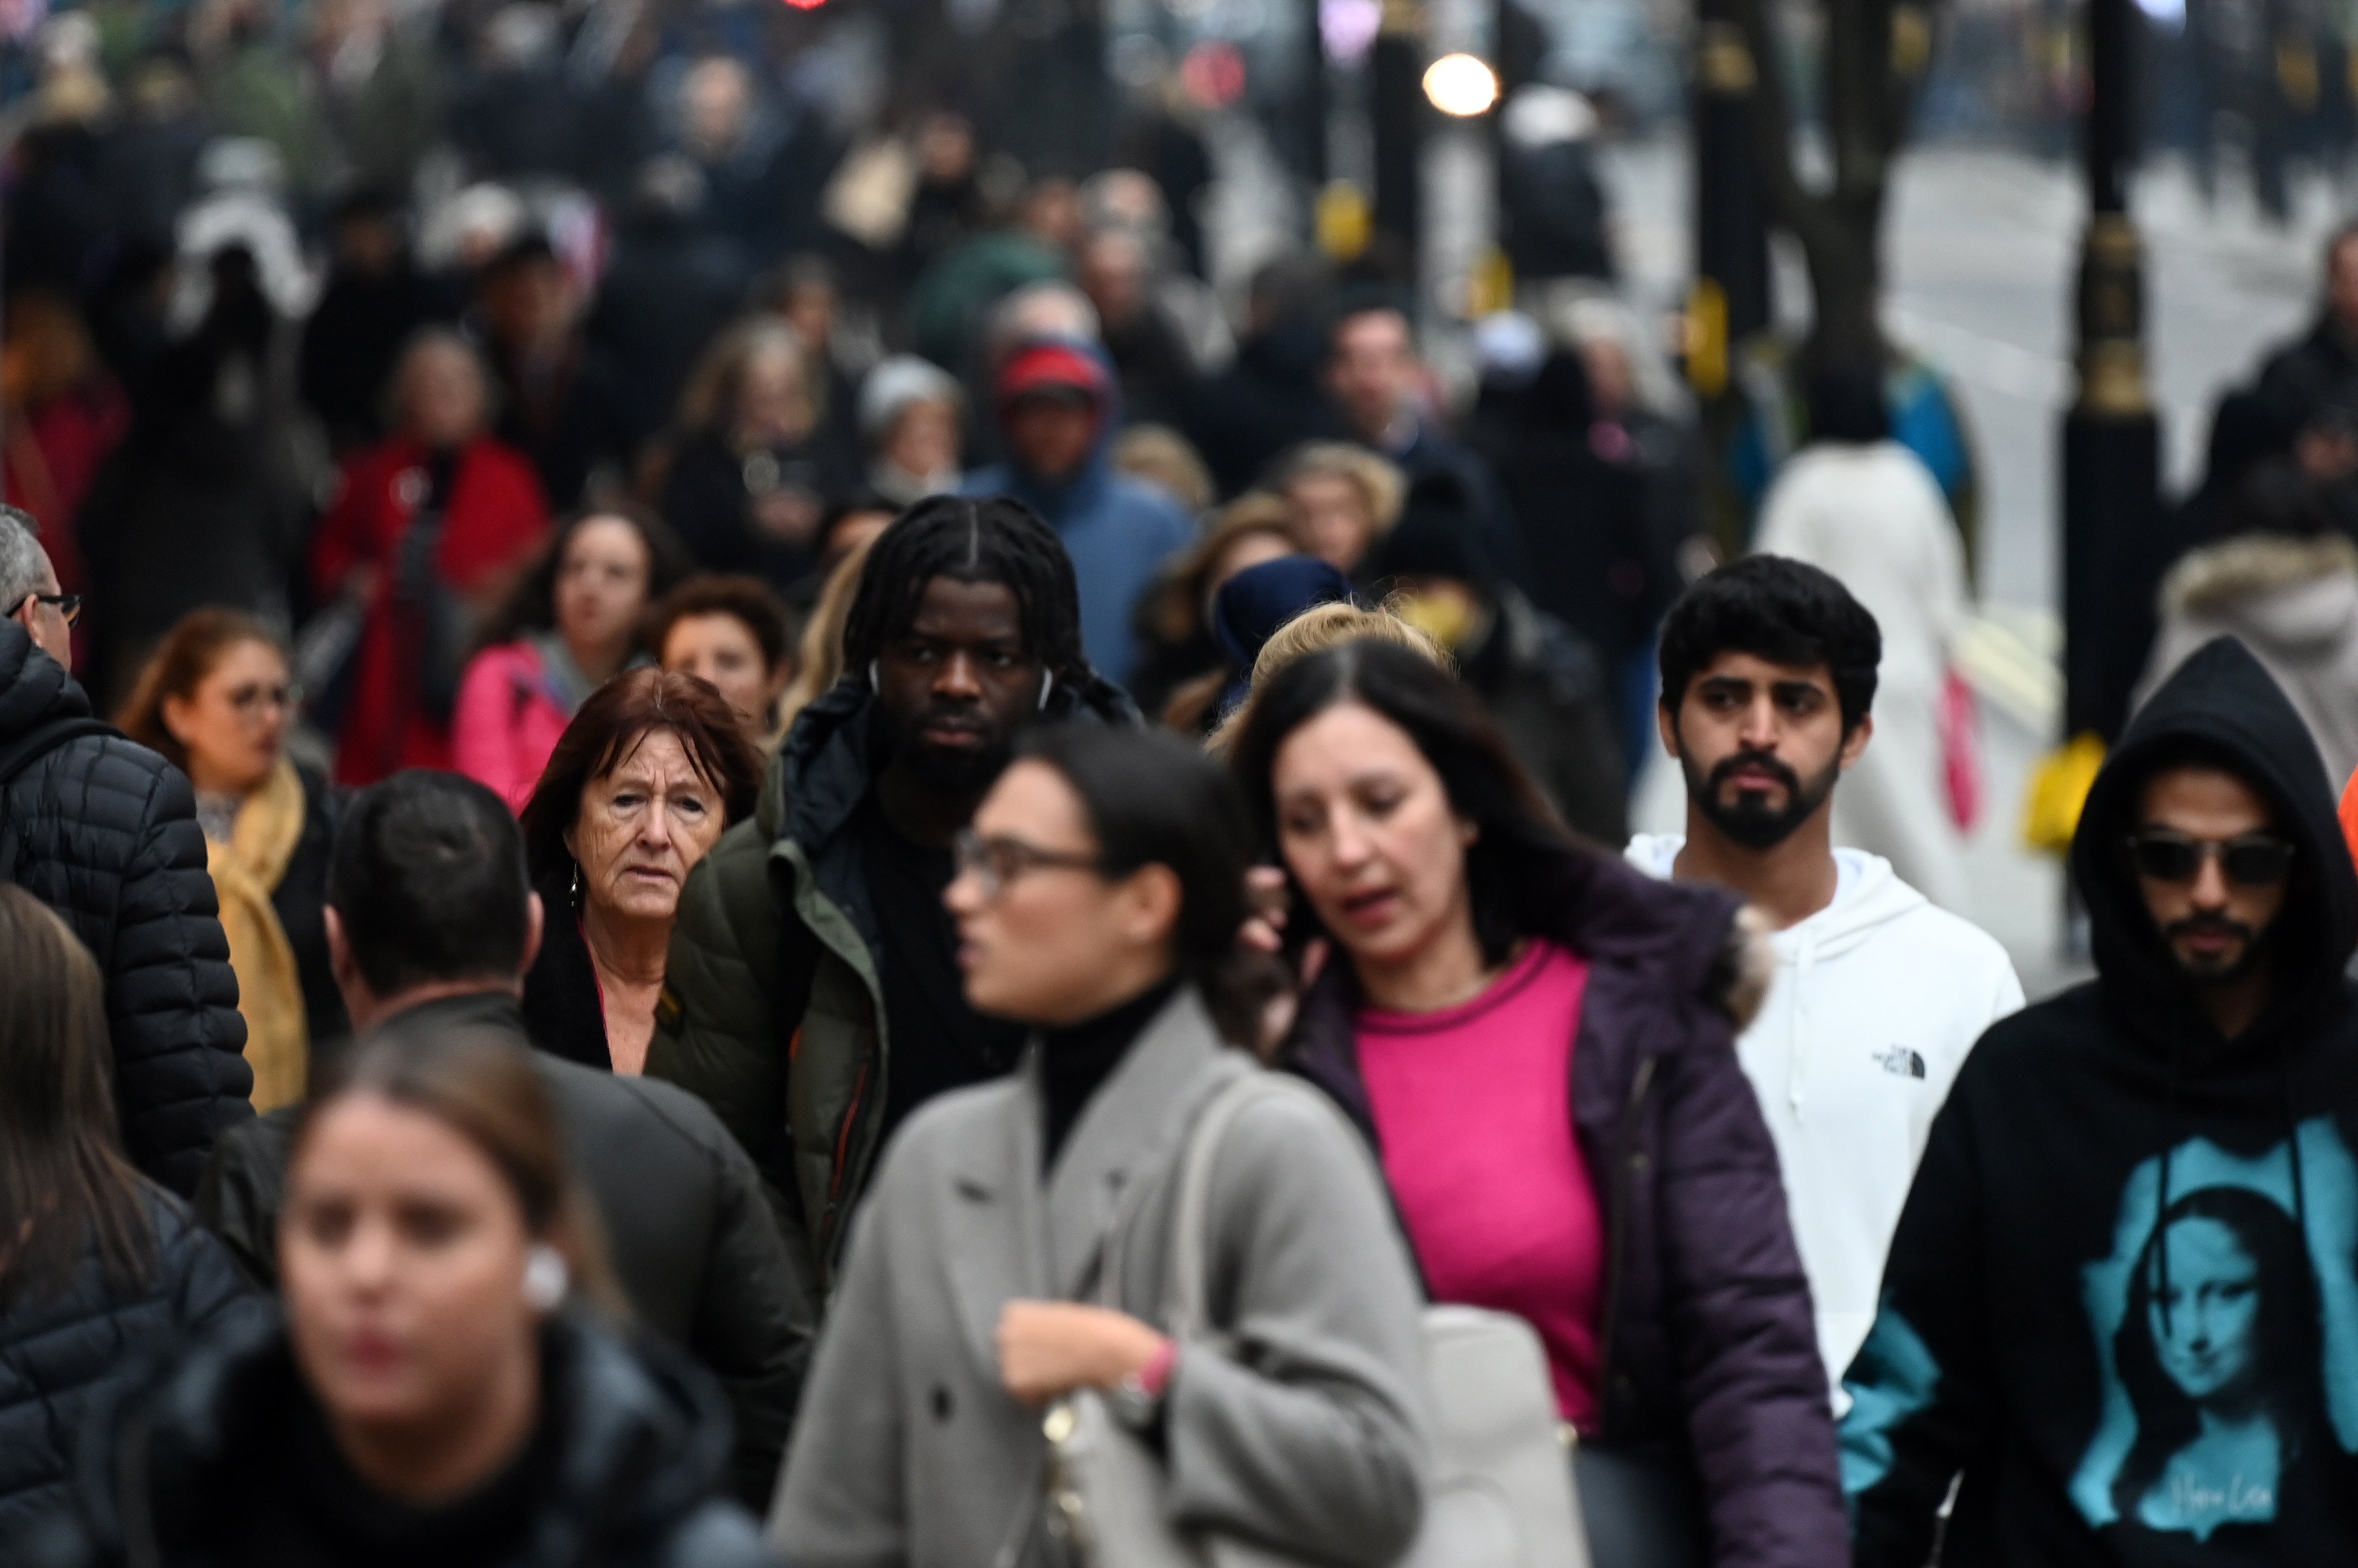
One in 10 households contains members of two or more ethnicities according to census data that reveals an “increasingly multi-cultural society”.
Around 2.5 million households (10.1%) in England and Wales had people from at least two different ethnic groups in 2021, the Office for National Statistics (ONS) said, up from 8.7% a decade earlier.
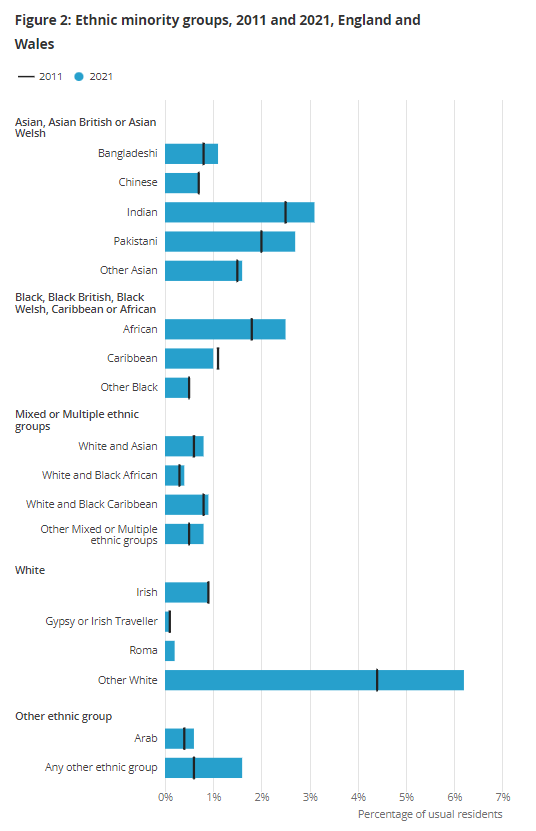
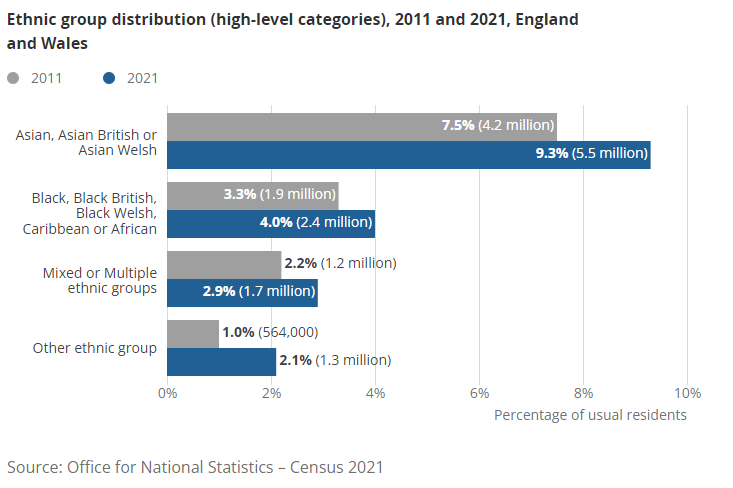
Meanwhile, the percentage of people identifying as white in 2021 was 81.7%, down from 86.0% a decade earlier, with the absolute number falling by 500,000.
The second most common ethnic group was “Asian, Asian British or Asian Welsh” at 9.3 per cent, up from 7.5 per cent in 2011.
Census deputy director Jon Wroth-Smith said: “This data highlights the increasingly multi-cultural society we live in”
Other key census findings
- The number of people identifying as White decreased by 500,000
- People identifying as Asian showed the greatest increase - 1.3 million since 2011
- Almost 100,000 people identify as Cornish
- Most common main languages in 2021 other than English were Polish (1.1 per cent of the population) and Romanian (0.8 per cent)
- Some 14 local authorities recorded more than half of their usual residents as identifying with an ethnic group other than white
The rise of ‘Other White’
The ONS said large ethnicity changes were seen in people identifying as “White: Other White”, which stood at 3.7 million (6.2 per cent) in 2021, up from 2.5 million (4.4 per cent) in 2011.
The number of people identifying their ethnic group as “Other ethnic group: Any other ethnic group” rose to 924,000 (1.6 per cent), up from 333,000 (0.6 per cent) in 2011.
The largest ethnic groups specified within “White: Other White” included “White: Polish”, with 614,000 (1 per cent) of the overall population identifying this way, and “White: Romanian”, with 343,000 people (0.6 per cent) identifying this way.
These ethnicities were also well-represented in common languages spoken other than English.
Polish was the most common language spoken other than English in 2021 (1.1 per cent of the population) while Romanian followed behind with 0.8 per cent of the population and Punjabi third (0.5 per cent).
The region with the highest percentage of people who reported Romanian as a main language was London (1.9 per cent, or 159,000 people), rising to 7.5 per cent in the borough of Harrow.
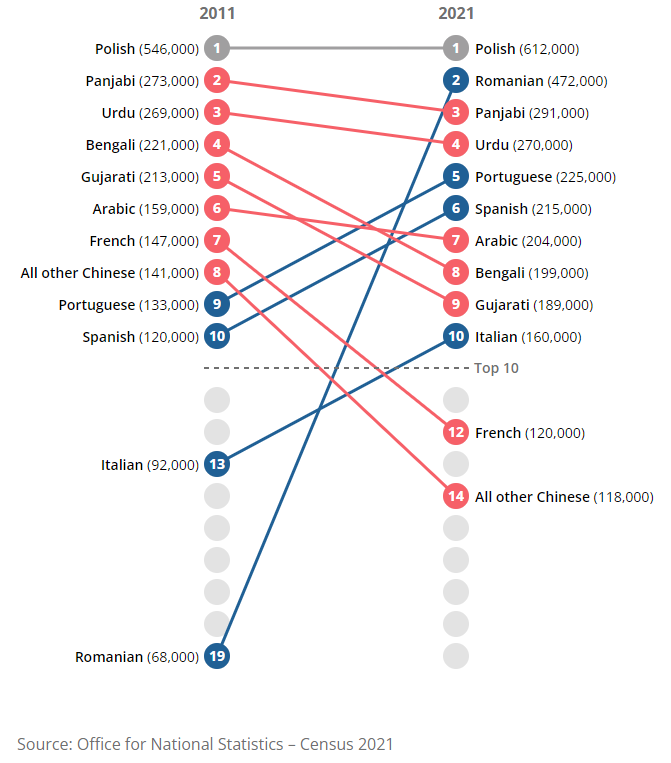
The East Midlands was the region with the highest percentage of people who had Polish as a main language (1.5 per cent, or 71,000), rising to 5.7 per cent in the local authority of Boston in Lincolnshire.
14 areas where White people are a minority
Leicester, Luton and Birmingham are among the areas of England where people identifying as white now form a minority of the population, census data shows.
Some 14 local authorities recorded more than half of their usual residents as identifying with an ethnic group other than white, with the highest proportion in the London boroughs of Newham (69.2 per cent), Brent (65.4 per cent) and Redbridge (65.2 per cent).
Outside London, the highest non-white proportion is in Slough in Berkshire (64.0 per cent), followed by Leicester (59.1 per cent), Luton (54.8 per cent) and Birmingham (51.4 per cent).
The new figures, which have been published by the Office for National Statistics (ONS), represent a snapshot of ethnicity of the resident population on the day of the last census, March 21 2021.
The other seven areas with a non-white population above 50 per cent are all in London: Harrow (63.5 per cent), Tower Hamlets (60.6 per cent), Ealing (56.8 per cent), Hounslow (55.9 per cent), Barking and Dagenham (55.1 per cent), Hillingdon (51.8 per cent) and Croydon (51.6 per cent).
Lewisham is the local authority with the highest proportion of people identifying as black (26.8 per cent), followed by Southwark (25.1 per cent) and Lambeth (24.0 per cent), all of which are in London.
Faith on the decline?
A major standout from the census was the proportion of the population describing themselves as Christian falling below half for the first time.
This comes as the number of people with “no religion” has almost trebled since the turn of the millennium.
Those looking for the region in England and Wales with the largest proportion of people with no religion should look no further than Caerphilly where 56.7 per cent claim to have no faith, Blaenau Gwent at 56.4 per cent, and Rhondda Cynon Taf at 56.2 per cent.
In England 55.2 per cent of people in Brighton and Hove said they had no religion.
The Christian strongholds across England are all in the northwest, with Knowsley at 66.6 per cent, Ribble Valley at 66.4 per cent, and Copeland at 65.1 per cent, while in Wales it is the Isle of Anglesey and Flintshire, both at 51.5 per cent.
Meanwhile, the borough of Tower Hamlets in east London has the largest proportion of Muslim people at 39.9 per cent, up from 38.0 per cent in 2011, while Harrow has the highest proportion of Hindus, at 25.8 per cent, up from 25.3 per cent in 2011.
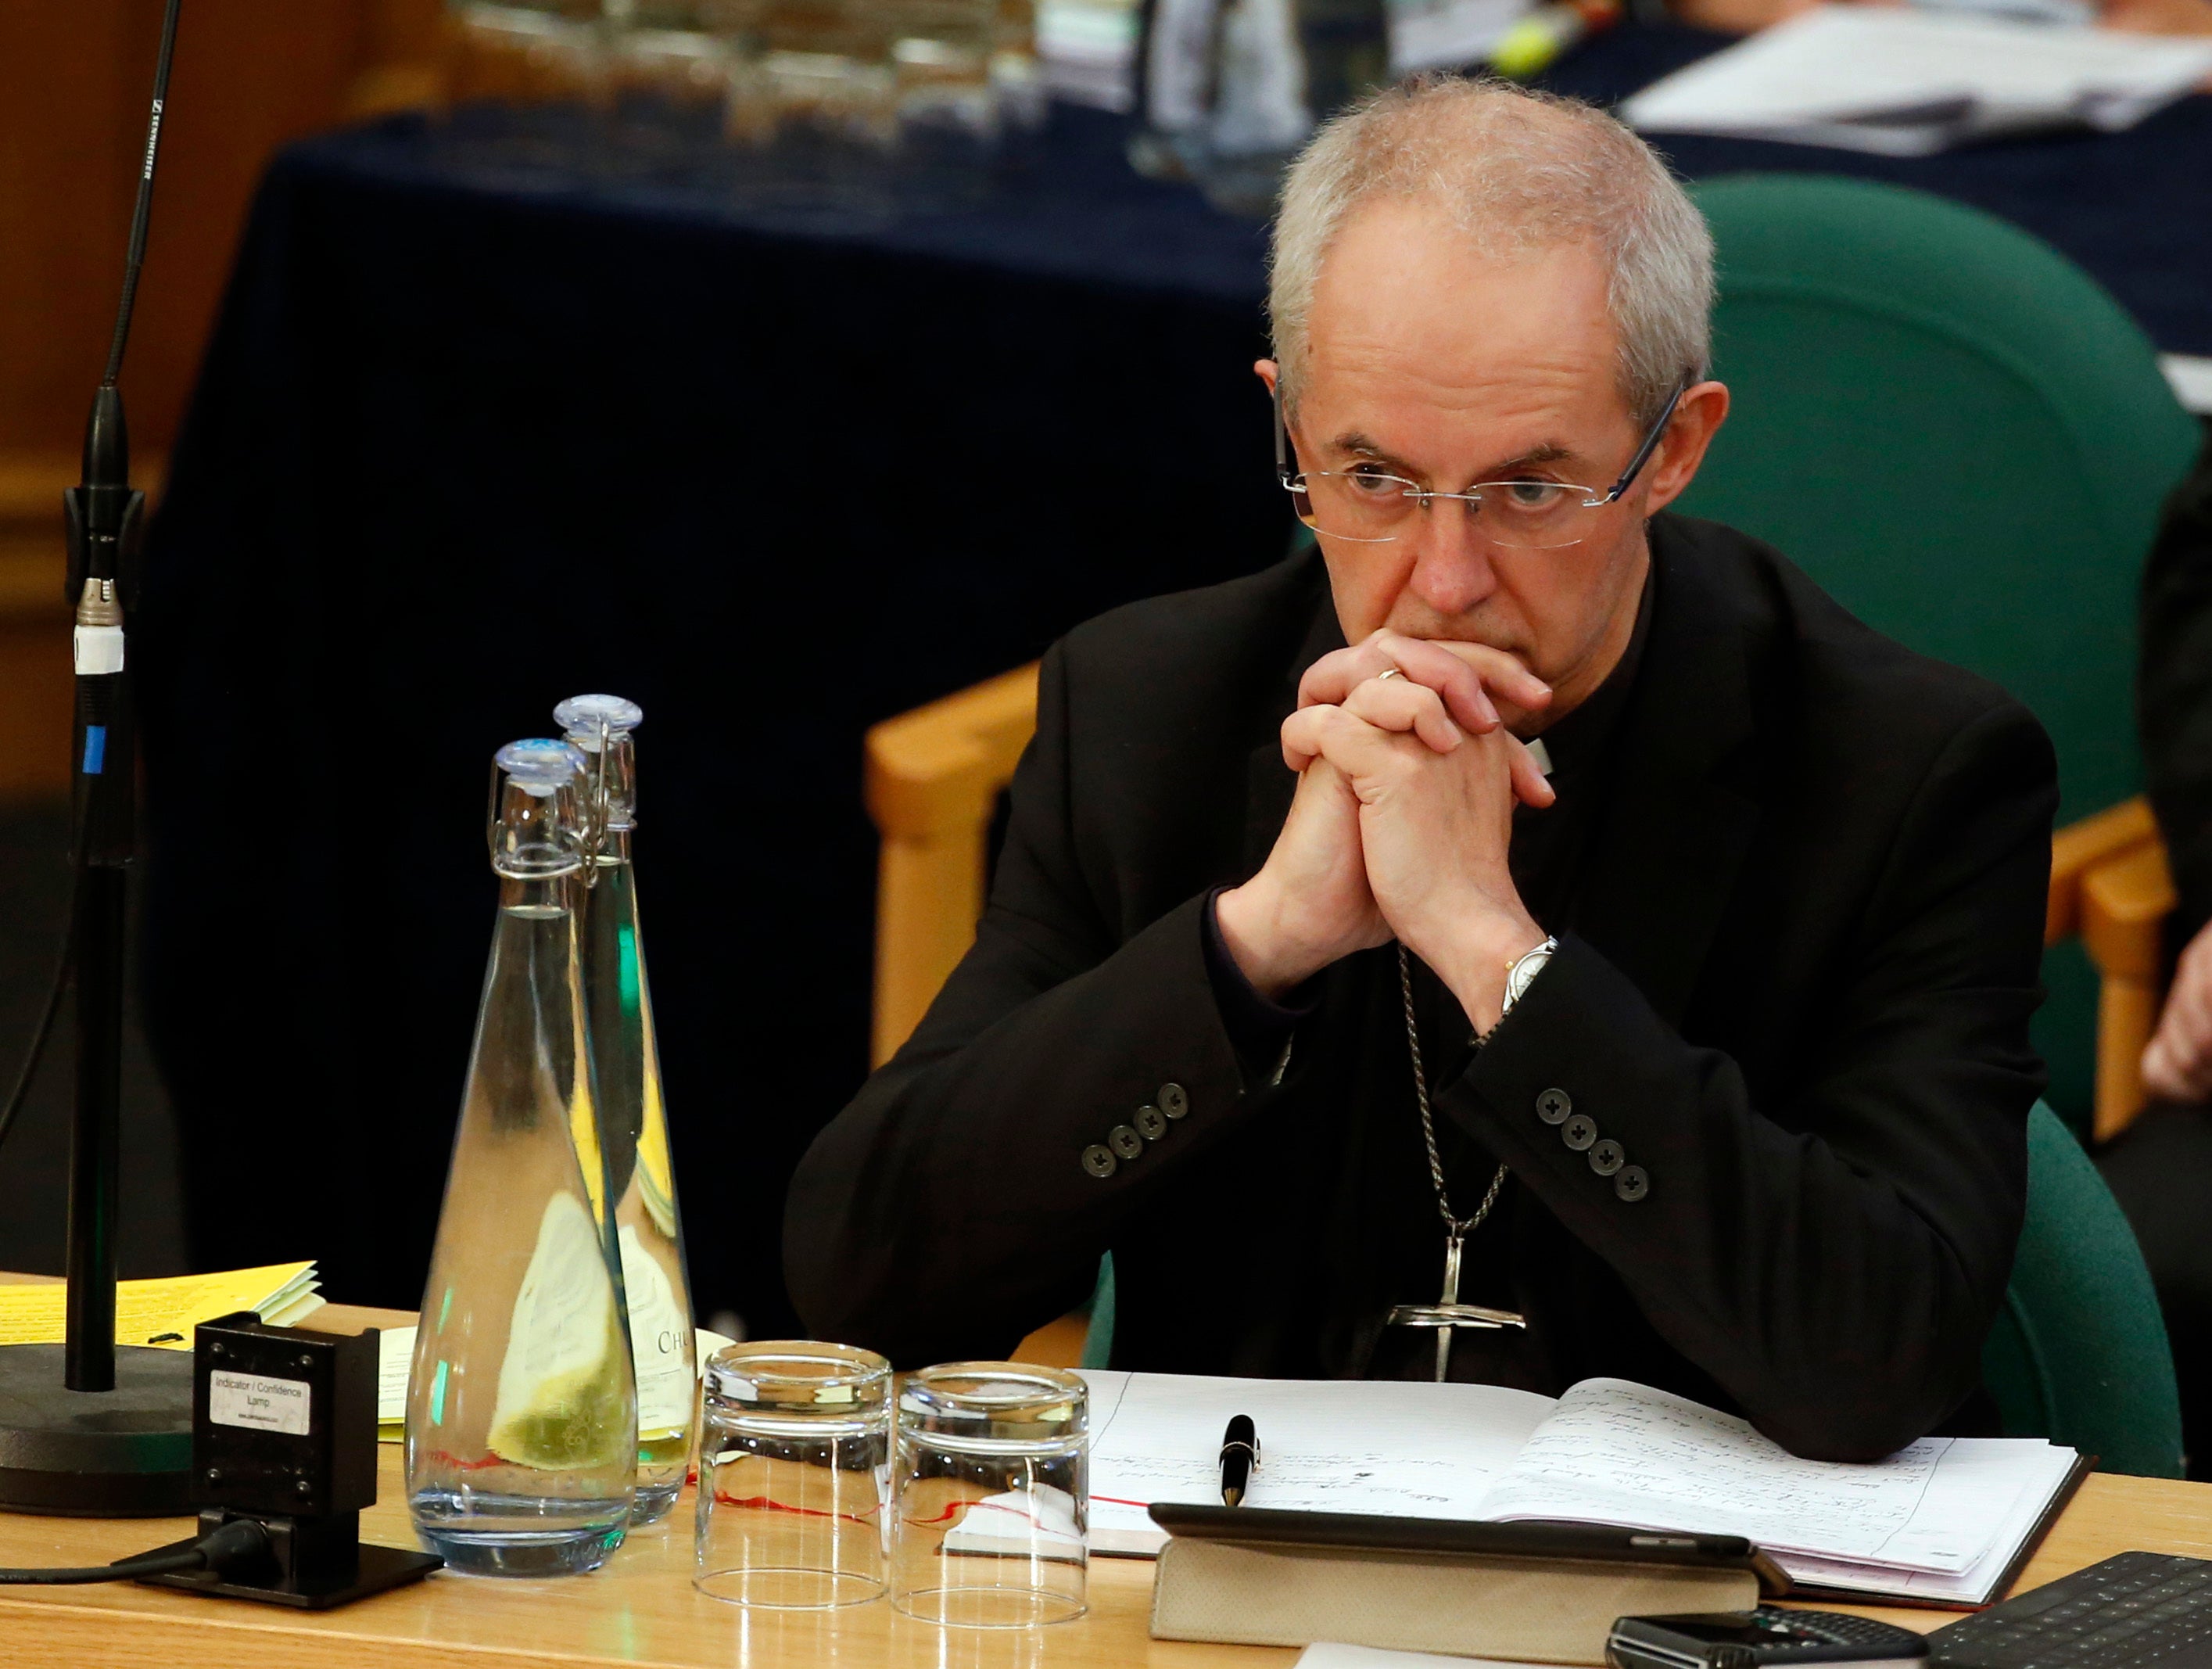
The Archbishop of York said the country had “left behind the era when many people almost automatically identified as Christian.”
The Most Reverend Stephen Cottrell said: “The Christian church exists to share the good news of Jesus Christ, serve our neighbour and bring hope to a troubled world. That’s what we’ve done for 2,000 years, in times of war and peace; hardship and plenty; revival and decline and it’s what we must do now more than ever.
“It’s not a great surprise that the Census shows fewer people in this country identifying as Christian than in the past, but it still throws down a challenge to us not only to trust that God will build his kingdom on Earth but also to play our part in making Christ known.”
100,000 identify as Cornish
Almost 100,000 people identify as Cornish, according to the new data.
In Cornwall around 80,000 people (14 per cent) reported a Cornish only identity. This is a rise from 53,000 (9.9 per cent) in 2011, the Census 2021 revealed.
A further 9,000 people (1.6 per cent) selected Cornish in combination with one or more UK identities - up from 5,000 (1 per cent) in 2011.
The Census 2021 allowed people to identify as Cornish via a search-as-you-type functionality, making it easier for people to self-define on the online questionnaire. They could also write in Cornish on the paper form. Both were encouraged by Cornwall Council, the unitary authority, which said that greater evidence of identity would boost its funding settlement.