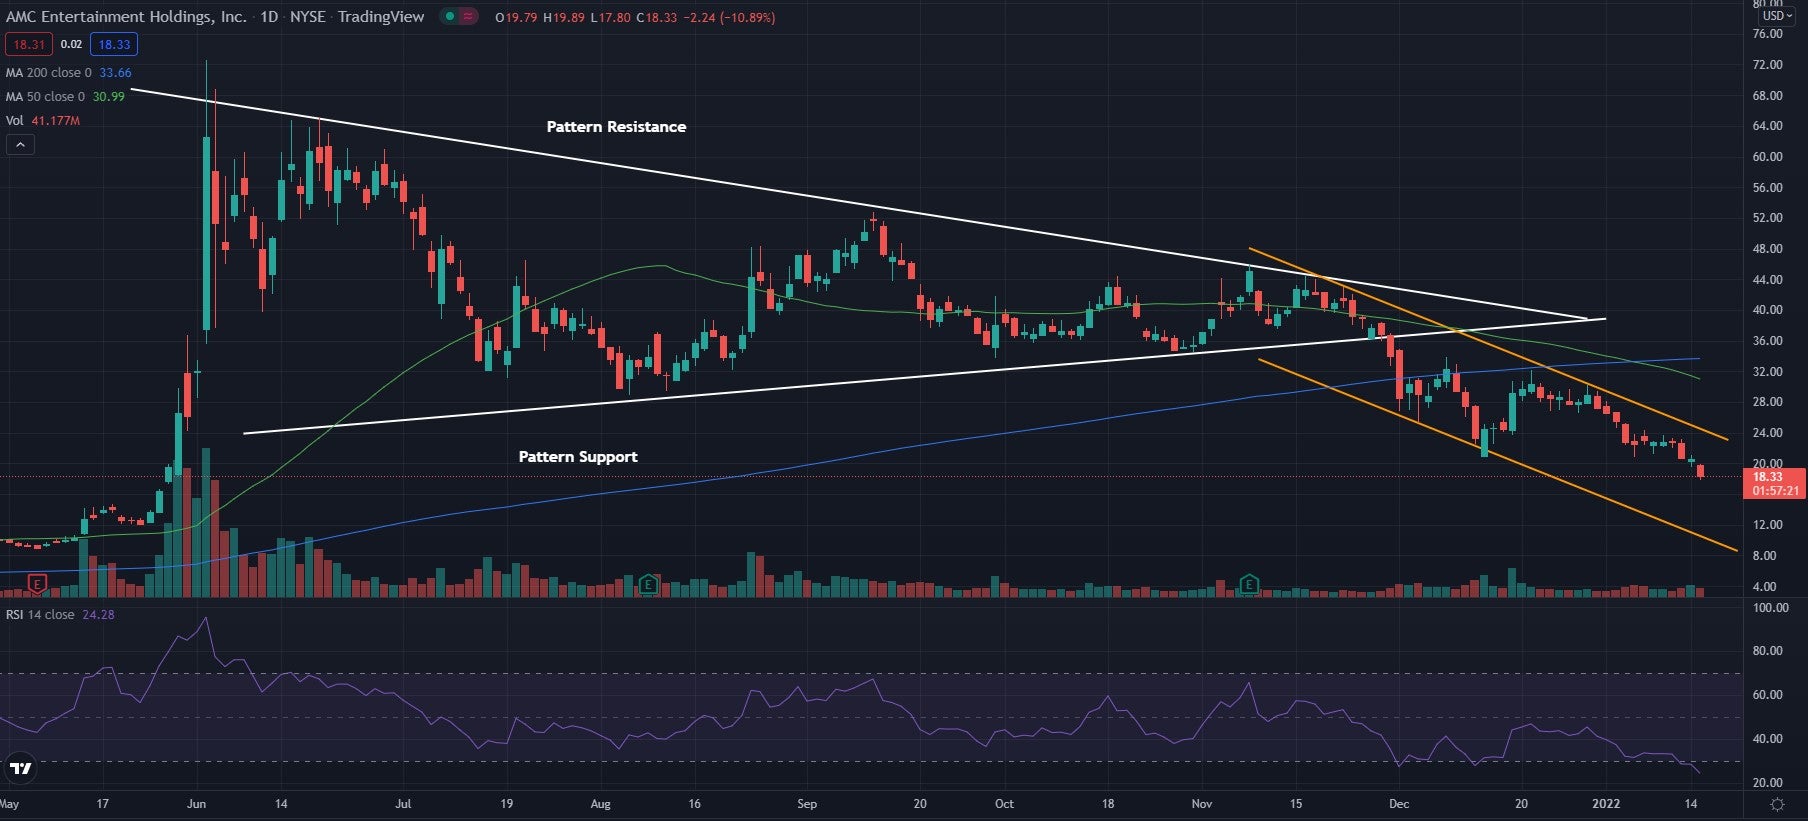
AMC Entertainment Holdings Inc. (NYSE:AMC) shares are trading lower Tuesday, having fallen below support in what technical traders call a pennant pattern. The stock has been trending on social media sites throughout the day as shares are seeing a strong down day, dropping over 10%.
AMC was down 10.57% at $18.40 at the time of publication.
See Related: Wall Street Fund Managers Tracking Retail Traders On Social Media And Message Boards
AMC Daily Chart Analysis
- The stock price falling below pattern support is a bearish sign for AMC, showing that higher lows were unable to continue to form and that a bearish trend has started. Lower highs and lower lows (orange) have been printed over the last few weeks.
- The stock trades below both the 50-day moving average (green) and the 200-day moving average (blue). This indicates bearish sentiment, and each of these moving averages may hold as an area of resistance in the future.
- The Relative Strength Index (RSI) continues to fade lower and now sits at 24. This shows that the RSI is in the oversold region and there are many more sellers than buyers in the market. If the RSI continues to stay within the oversold range, the stock may continue to trend downward.

What’s Next For AMC?
The break of support is what bears were looking to see in the stock, hinting more downward movement was coming in the future. This has now happened, as the stock fell below both moving averages, showing the sentiment in the stock has changed to become more bearish.
Bears are in control of the stock and are looking to see it continue to fall lower and hold below the moving averages.
Bulls are looking to see a bounce in the coming days and for AMC to begin establishing higher lows. They then want the stock to be able to cross back above the moving averages.
Photo: Courtesy of Valerie Reneé on Flickr


