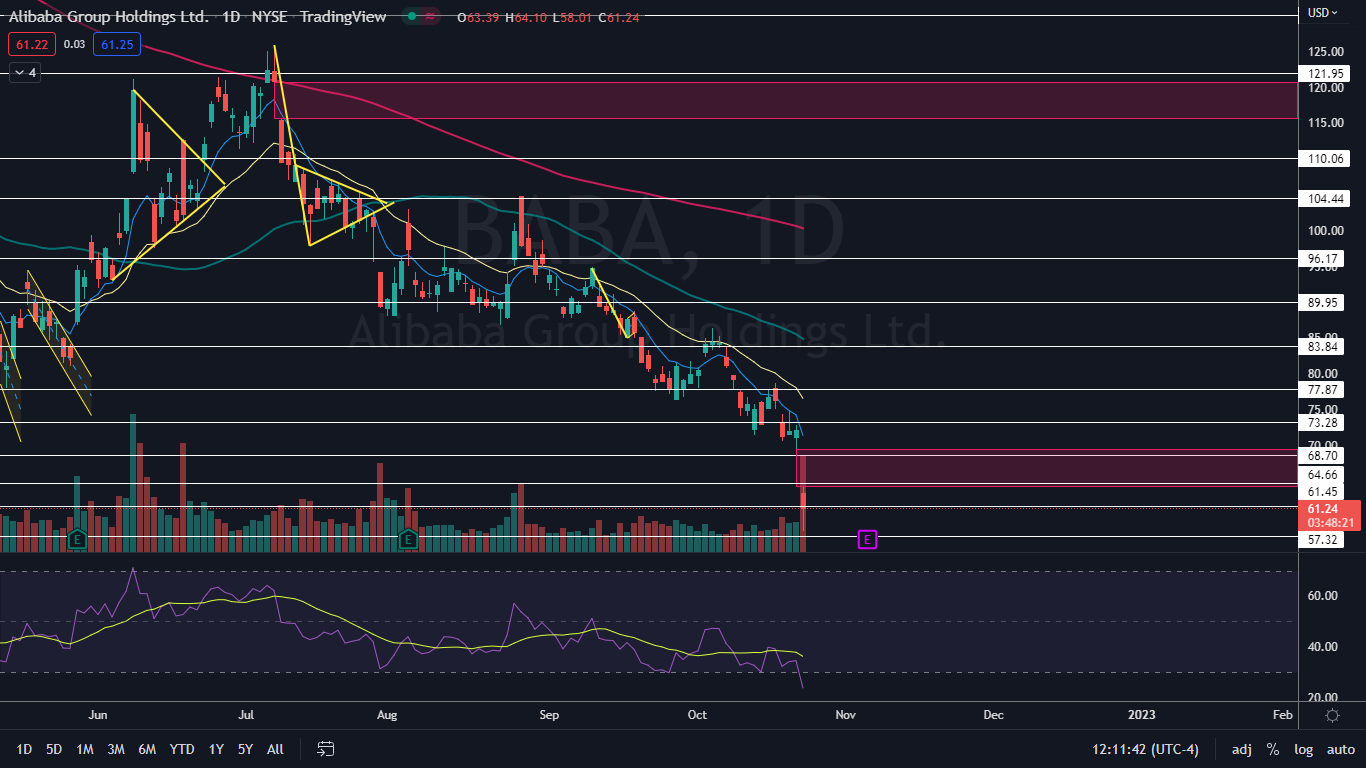
Alibaba Group Holdings, Ltd - ADR (NYSE:BABA) plunged 20% off Friday’s closing price at one point Monday before bouncing up about 6% from the low-of-day.
The Chinese multinational tech company plummeted in tandem with a number of other China-based stocks in the tech sector. The Hang Seng Index closed 6.36% lower at $15,180.70, a more than 42% decline from the Jan. 4 opening price.
Although the Hang Seng and many Chinese stocks trading on American exchanges have been in steep downtrends for much of this year, the sharp slide on Monday came after Chinese President Xi Jinping cemented himself an unprecedented third term on Sunday... Read More
A reshuffling in the Politburo Standing Committee to elect loyalists also weighed on Chinese tech stocks. The move has investors worried the Chinese Communist Party will increase its crackdowns on big tech, which could be bad for China’s economy.
Alibaba started to bounce up from the lows intraday for technical reasons: the sharp decline dropped the stock’s relative strength index (RSI) into oversold territory, which indicated a rally on smaller timeframes was likely to come.
Want direct analysis? Find me in the BZ Pro lounge! Click here for a free trial.
The Alibaba Chart: Alibaba’s RSI dropped to 23% Monday morning, which prompted some traders to buy the stock for a short-term bounce. When a stock’s RSI drops below the 30% level it can be a buy signal for technical traders.
- If Alibaba closes the trading session above $60, the stock is likely to print a hammer candlestick, which could indicate higher prices will come again on Tuesday. If the stock closes the trading session near the low-of-day, Alibaba will print a bearish kicker candlestick, which could indicate lower prices are on the horizon.
- If Alibaba trends higher on Tuesday, the upper gap that exists between $64.10 and $69.47 is likely to fill. In that case, traders can watch for a bearish reversal candlestick to form near the upper range of the gap, which could indicate the next lower high in the downtrend has occurred.
- Alibaba has resistance above at $61.45 and $64.66 and support below at the September 2015 all-time low of $57.32. Under that level, there is psychological support at $50.

Photo: Courtesy Alibaba


