Chinese e-commerce stocks Alibaba (BABA) and JD.com (JD) have had a rough run.
U.S.-listed equities have struggled this year and, more specifically, tech stocks have struggled mightily. Even more specifically, growth stocks have struggled, along with Chinese equities.
Actions from the Securities and Exchange Commission aren't helping.
The culmination of negative developments is weighing on these two.
Alibaba’s decline started before the rest of the market, as it butted heads with the Chinese government.
While that situation has seemed to cool, the stock continues to get punished. The shares are down about 9% on Monday and are 75% off the highs from October 2020.
In the case of JD.com, the shares are down more than 10% on the day and are down more than 60% from its highs.
The company last week reported earnings, and the shares gave up 15% on Thursday after the report and then another 8.6% on Friday.
I can’t help but think that these two stocks are now deeply oversold. Of course, oversold stocks can become even more oversold. But let's look at the charts.
Trading Alibaba Stock
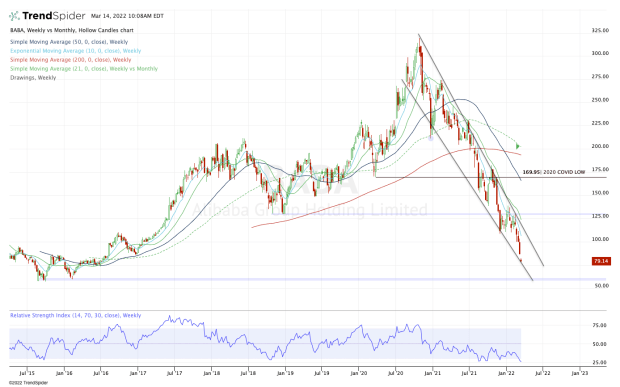
Chart courtesy of TrendSpider.com
Alibaba stock sports a large, sharp and painful falling wedge pattern. At one point, it looked like it was bottoming and rotating back over $130 — that was a monthly up rotation at one point in January — but then it rolled over again and $130 became stout resistance.
"Dreadful" is the word that comes to mind when I look at this chart. On Friday, it broke $100. Now Alibaba is already trading below $80. There’s no bullish divergence on the RSI, either.
Perhaps this $75 to $80 area acts as support and triggers a bounce, but there’s not enough of a reason to get long here unless we see some type of rotation over today’s highs.
If the stock does rally, keep an eye on the declining 10-day and 10-week moving averages, as well as the $100 level. For now, I expect these measures to be resistance.
On the downside, $60 was strong support. And while it doesn’t seem like the stock can go down that far, the current action leans toward disproving that assumption.
In short, I’m looking for a deeper dip toward support or a rally into resistance.
Trading JD.com Stock
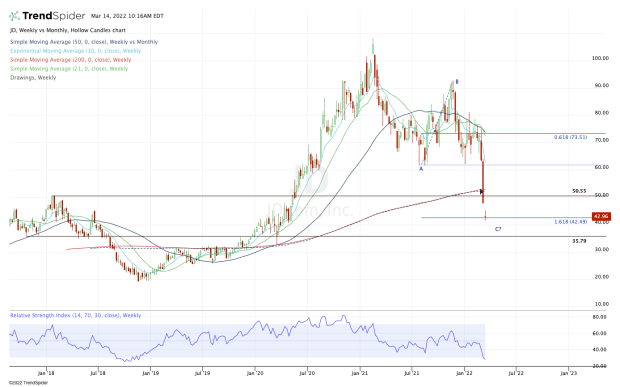
Chart courtesy of TrendSpider.com
JD is taking a hit after its Thursday earnings report, making no effort to hold prior support at $60.
With last week’s action, it blew through the 200-week and 50-month moving averages. Without even so much as a bounce, it also cut through the key $50 area.
With this morning’s gap down, JD.com stock is trading right into the 161.8% downside extension. That has my attention.
Let’s see how JD closes today. If it gives us the doji candle look it’s giving now, a rotation over this week’s high could put the gap-fill near $48 in play. Above $50 opens the door back to the 200-week moving average.
Until the downtrend ends, it’s possible that $36 is eventually in play. That was a prior support level both in 2018 and 2020.