Shopify, Inc (NYSE:SHOP) was plunging over 10% at one point on Monday, as the stock continued a consistent downtrend which began on April 5, when Shopify broke bearishly from a triangle pattern.
A downtrend occurs when a stock consistently makes a series of lower lows and lower highs on the chart.
The lower lows indicate the bears are in control, while the intermittent lower highs indicate consolidation periods.
Traders can use moving averages to help identify a downtrend, with descending lower timeframe moving averages (such as the eight-day or 21-day exponential moving averages) indicating the stock is in a steep shorter-term downtrend and descending longer-term moving averages (such as the 200-day simple moving average) indicating a long-term downtrend.
A stock often signals when the lower low is in by printing a reversal candlestick such as a doji, bullish engulfing or hammer candlestick. Likewise, the lower high could be signaled when a doji, gravestone or dragonfly candlestick is printed. Moreover, the lower lows and lower highs often take place at resistance and support levels.
In a downtrend the "trend is your friend" until it’s not and in a downtrend, there are ways for both bullish and bearish traders to participate in the stock:
- Bearish traders who are already holding a position in a stock can feel confident the downtrend will continue unless the stock makes a higher high. Traders looking to take a position in a stock trading in a downtrend can usually find the safest entry on the lower high.
- Bullish traders can enter the trade on the lower low and exit on the lower high. These traders can also enter when the downtrend breaks and the stock makes a higher high, indicating a reversal into an uptrend may be in the cards.
- Want direct analysis? Find me in the BZ Pro lounge! Click here for a free trial.
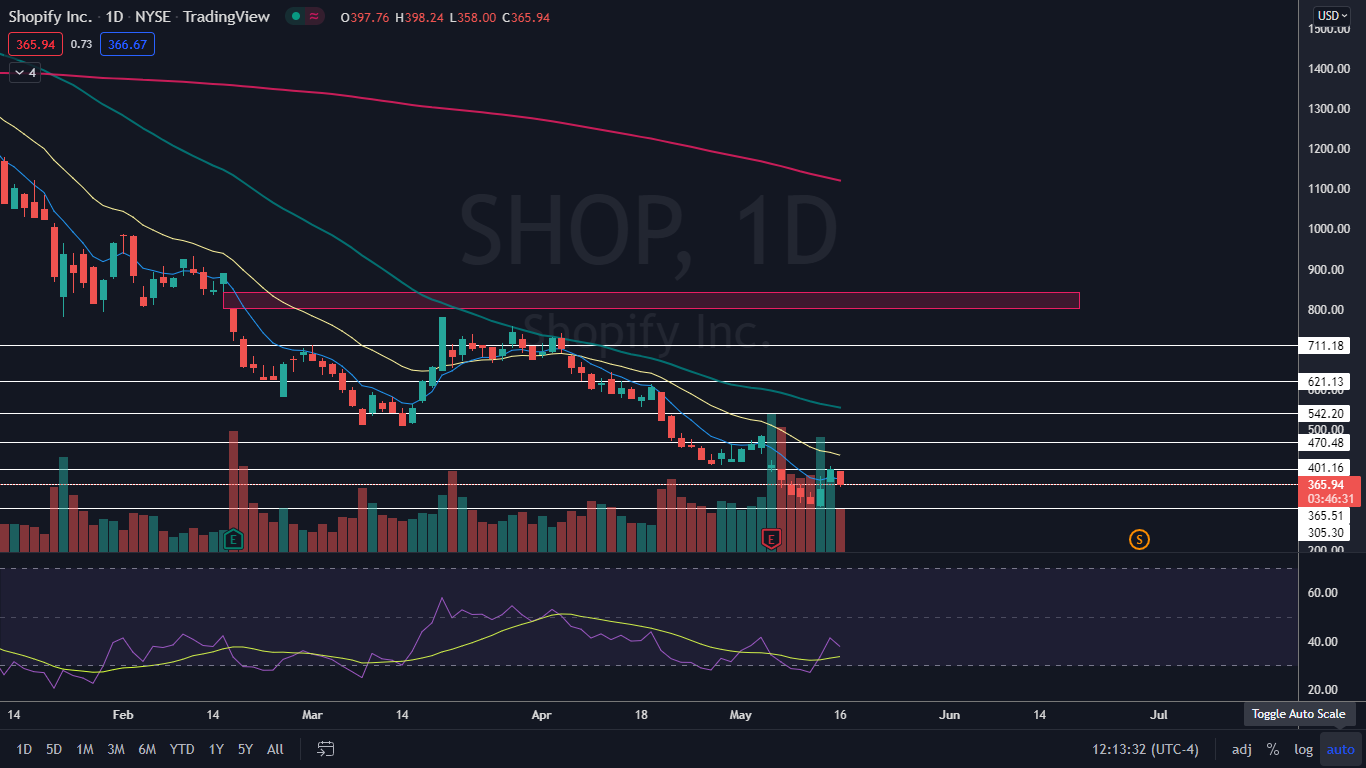
The Shopify Chart: Shopify’s most recent lower high in its downtrend was printed on Friday at $408.63 and the most recent confirmed lower low was formed at the $308.06 mark a day earlier, on Thursday. On Monday, Shopify was attempting to bounce up from its low-of-day, in tandem with the S&P 500, and if the stock can rise up above Friday’s high-of-day over the next couple of days, the downtrend will be negated.
- It’s possible that Shopify is settling into a bull flag pattern on the daily chart, with the pole formed between Thursday and Friday and the flag forming on Friday and Monday. If the bull flag becomes the dominant pattern, traders and investors can watch for the Shopify to break up from the flag formation on higher-than-average volume for confirmation.
- Shopify has a gap above between $800 and $843.18. Gaps on charts fill about 90% of the time, which makes it likely Shopify will rise up to fill the empty trading range in the future. If Shopify reaches the top of the gap, it will represent a 128% increase from the current share price.
- If the stock closes the trading session near its low-of-day price, it will print a bearish Marubozu candlestick, which could indicate lower prices will come on Tuesday. If the stock closes the trading day with a lower wick, it will print a hammer candlestick, which could indicate a higher low has been printed and Shopify will trade higher and possibly break up from the bull flag on Tuesday.
- Shopify has resistance above at $401.16 and $470.48 and support below at $365.51 and $305.30.