
Many traders and investors feel you have to pick the direction right on a stock to make money trading. Certainly, there is some truth to that. Astute traders, however, know that dampening directional bias and focusing on comparative relative performance can also be a very profitable and lower risk way to position to profit.
Looking at two stocks that normally trade in a similar manner, called correlated, but are beginning to trade differently, or diverge, can set up for a pairs trade of going short the relative out-performer and going long the relative under-performer. The profit is then realized when these two stocks move back, or mean-revert, to the more traditional relationship.
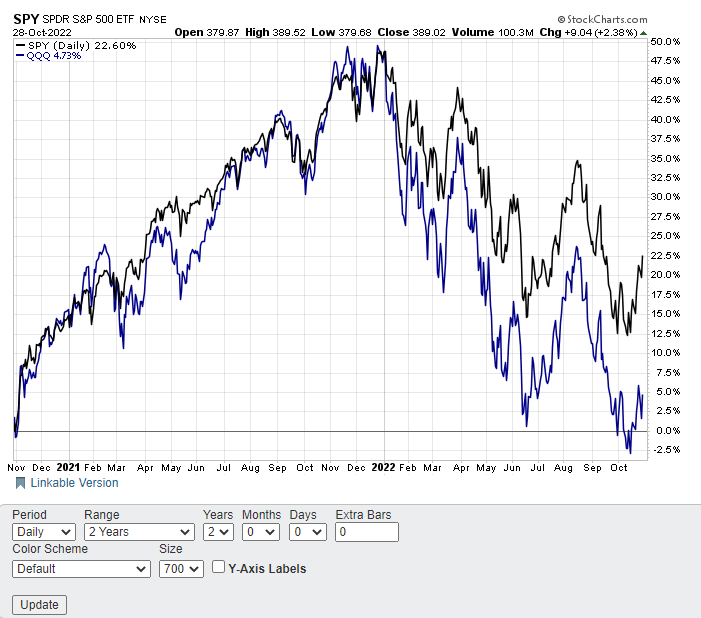
A quick look at the recent performance between the S&P 500 (SPY) and NASDAQ 100 (QQQ) shows how the two have diverged over the past few months, as seen in the chart below. These two had traded in a very similar manner until early 2002, when SPY started to dramatically out-perform QQQ. The performance gap is now nearing an extreme at nearly 18%, setting up for a relative value trade of shorting SPY and buying QQQ.
A look back at the relative performance between tech giant Microsoft (NASDAQ:MSFT) and oil giant ExxonMobil (NYSE:XOM) over the past three years highlights just how much performance ultimately mean reverts. The chart below shows how Microsoft stock, which was such a massive out-performer until late 2021, has now under-performed former laggard ExxonMobil over the past three years.
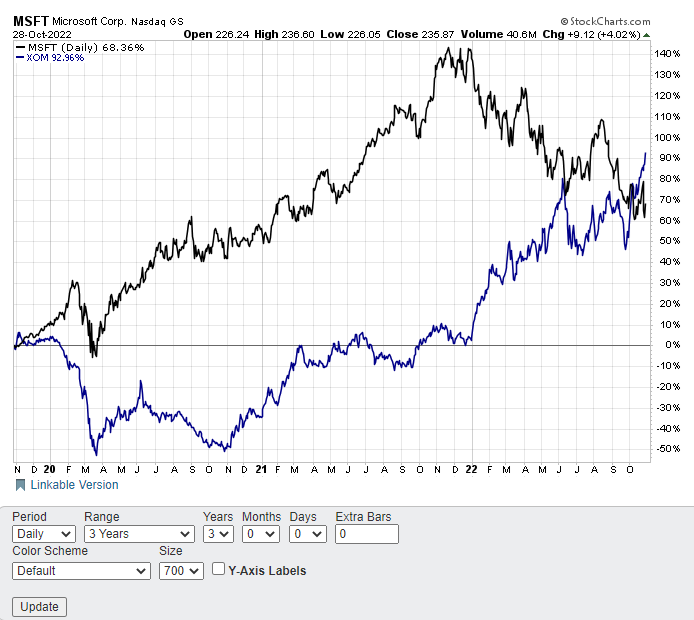
At the widest, MSFT was up nearly $140% over the past three years while XOM was essentially flat. That huge performance gap has now swung back sharply the other way. XOM has now overtaken MSFT by almost 25% over that same time frame. ExxonMobil stock has almost doubled this year while Microsoft stock has been nearly cut in half. Taking counter-trend positions at extremes by shorting the out-performer and buying the under-performer usually pays.
That said, now ExxonMobil is starting to look at little extreme on a comparative basis. A look at the price action between XOM and oil prices will show just how much.
Oil prices and oil stocks are normally well-correlated, which makes intuitive sense. The chart below of the relationship between XOM and West Texas Intermediate Crude ($WTIC) highlights that these two were virtually in lockstep until July. Then crude oil prices continued to fall while the price of XOM exploded higher. In fact, XOM stock is now trading at the biggest comparative premium to oil prices in the past several decades.
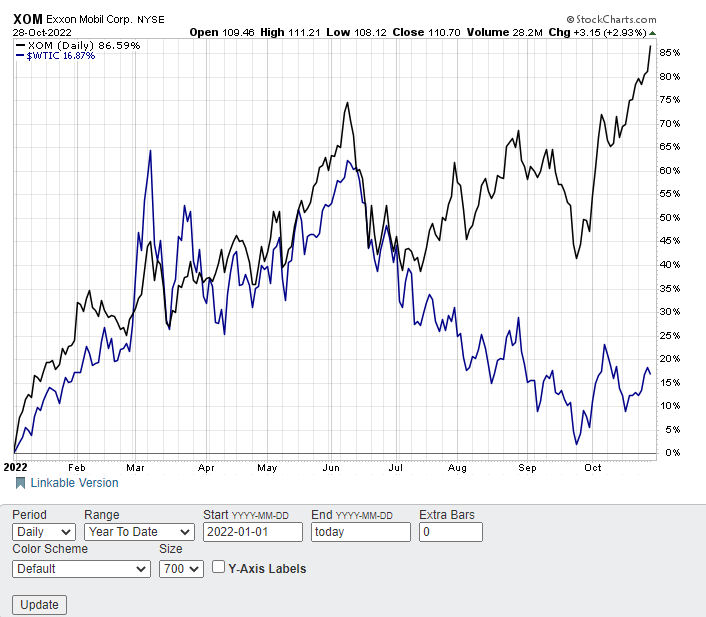
A look back at the last time oil prices spiked and then dropped sharply in 2007 shows that XOM stock price dropped as well. The most recent meteoric rise and fall in oil prices this year has now led to XOM stock racing to new all-time highs even after oil gave back much of the big gains.
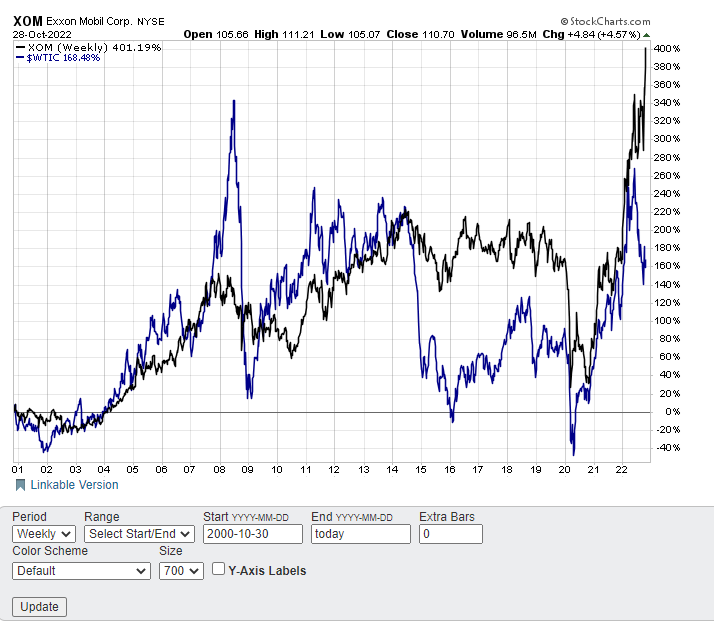
Caution is warranted in oil stocks like XOM going forward unless oil prices shoot up significantly. Shorting XOM stock and buying oil is beginning to look attractive on a comparative basis.
This type of relative value, or pairs trade, is a core strategy we employ in the POWR Options Portfolio.
But instead of shorting and buying stocks, we use bearish put and bullish call options to structure our pairs trades. This greatly lowers the initial cost of the trade but still takes a very similar approach. Plus we use a similar comparative performance approach on stocks in the same industry that should be highly correlated.
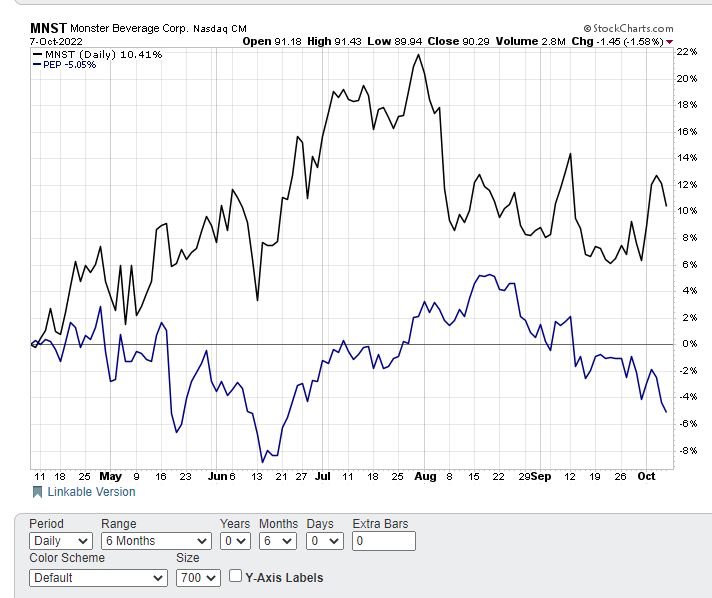
A 6-month chart of a past trade at inception on two beverage stocks is shown below. The POWR Options Portfolio bought bearish puts on the lower rated and out-performing MNST and bullish calls on the Buy rated and underperforming PEP. Note how performance gap was over 15%.
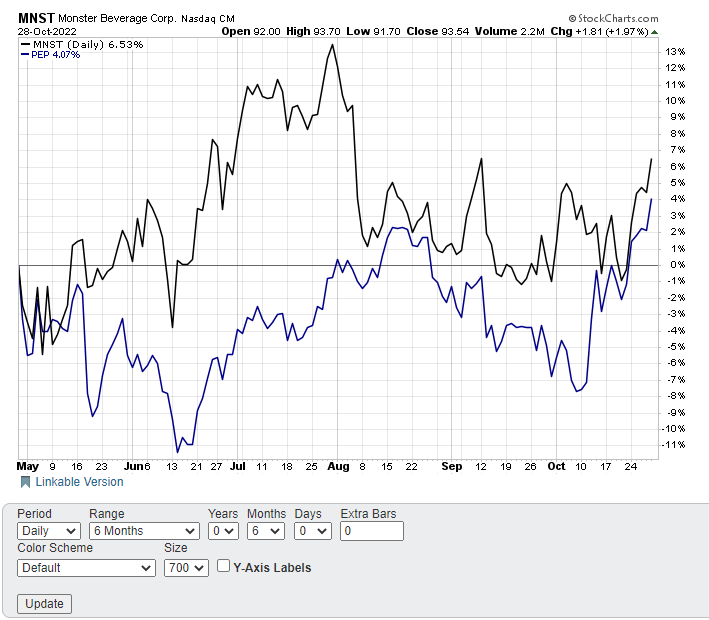
The similar 6-month chart below from just a few weeks later shows how PEP has recently out-performed and dramatically closed that performance gap by over 12% to roughly just 2.5% .
Our pairs trades have paid off nicely so far in the POWR Options Portfolio. Below is a table showing all the previous pairs trades and closed results to date.
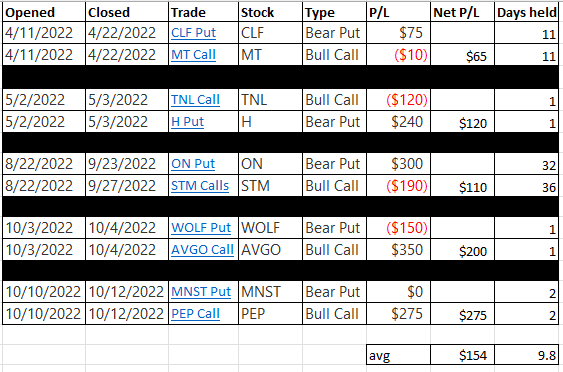
The table shows how each pairs trade involves buying a bullish call on a Buy rated stock and buying a bearish put on a lower rated Neutral or Sell stock.
Average gain is just over $150 per pairs trade or about 15% given the roughly $1000 initial combined outlay ($500 per call buy and $500 per put purchase).
Holding period is less than 10 days on average with two of the trades being closed the following day as the stocks reverted.
While we still pick individual stocks, both with bullish calls and bearish puts in the POWR Options portfolio, the addition of the pairs trades methodology has served to increase performance while dampening overall risk, especially in a consolidating market.
POWR Options
What To Do Next?
If you're looking for the best options trades for today’s market, you should check out our latest presentation How to Trade Options with the POWR Ratings. Here we show you how to consistently find the top options trades, while minimizing risk.
If that appeals to you, and you want to learn more about this powerful new options strategy, then click below to get access to this timely investment presentation now:
How to Trade Options with the POWR Ratings
All the Best!
Tim Biggam
Editor, POWR Options Newsletter
SPY shares closed at $389.02 on Friday, up $9.04 (+2.38%). Year-to-date, SPY has declined -17.15%, versus a % rise in the benchmark S&P 500 index during the same period.
About the Author: Tim Biggam

Tim spent 13 years as Chief Options Strategist at Man Securities in Chicago, 4 years as Lead Options Strategist at ThinkorSwim and 3 years as a Market Maker for First Options in Chicago. He makes regular appearances on Bloomberg TV and is a weekly contributor to the TD Ameritrade Network "Morning Trade Live". His overriding passion is to make the complex world of options more understandable and therefore more useful to the everyday trader. Tim is the editor of the POWR Options newsletter. Learn more about Tim's background, along with links to his most recent articles.
A New Way To Profit From Pops And Pullbacks With Lower Risk Pairs Trades StockNews.com


