
Stocks continue to climb higher in a seemingly unrelenting melt-up. The bear market feels like a distant memory. Interest rates have fallen, inflation has lessened, and oil is back well below $100 a barrel.
All is back being good again in the world of stocks. It took less than a month for everything to be resolved.
Recessionary fears have faded for now. Fear has given way to greed. But as Warren Buffett so wisely said “Be fearful when others are greedy”.
Here are 4 big reasons why it is time to put the greed in your favor and play the probabilities by positioning to profit from a pullback with puts:
Technicals
For our purposes, we will be using the NASDAQ 100 (QQQ) as a proxy for stocks generally. The S&P 500, Russell 2000 and Dow Jones all have displayed similar patterns, but the Nasdaq names that initially got hit the hardest have now rallied the most.
The chart below shows that the QQQ has once again gotten to extremely overbought readings. 9-day RSI is well over 70. MACD is fast approaching the loftiest levels of the past year.
Bollinger Percent B is hovering at the 100 area. QQQ is trading at a big premium to the widely followed 20-day moving average.
Previous times all these indicators aligned in a similar fashion marked significant short-term tops in the QQQ-highlighted in red on the chart.
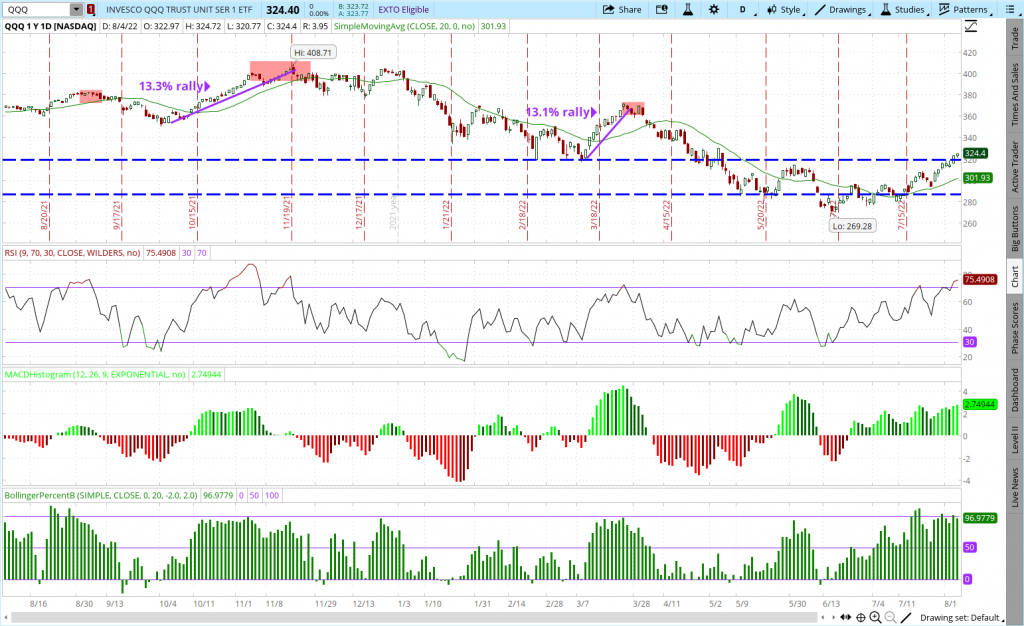
QQQ is now up over 15% in the past three weeks since bottoming out in mid-July. The previous two rallies that that were highlighted after hitting oversold levels both stalled out after a 13% run up-so this rally is getting a little long in the tooth.
Those rallies also retraced back well below the 20-day moving average before finding some support. A move back below the $320 inflection point and towards the 20-day moving seems like the most likely course.
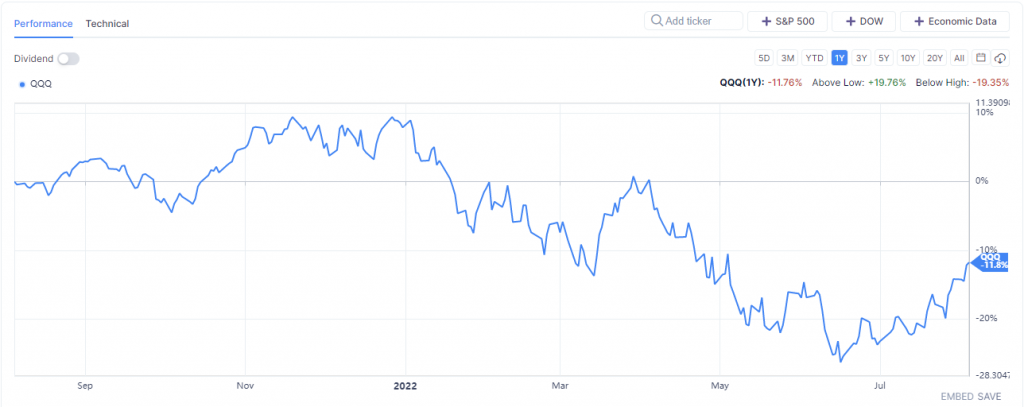
Interesting to note that QQQ is now slightly more off the lows of the past year (19.76%) than below the highs of the past year (19.35%).
Valuations
Earnings season has been good, but not great. While the headline numbers may seem solid on the surface, a look below the hood shows some issues.
The following is taken from the most recent report from FactSet. It shows that the magnitude of the earnings is below average and analysts are already tooling down estimates for both Q3 and Q4.
- Percentage of Companies Beating EPS Estimates (68%) is Below 5-Year Average
- Earnings Surprise Percentage (+3.1%) is Below 5-Year Average
Analysts are making larger cuts than average to EPS estimates for S&P 500 Companies for Q3, according to the latest data from FactSet. During the month of July, analysts lowered EPS estimates for the third quarter by a larger margin than average.
The Q3 bottom-up EPS estimate (which is an aggregation of the median EPS estimates for Q3 for all the companies in the index) decreased by 2.5% (to $57.98 from $59.44) from June 30 to July 28.
The decline in the bottom-up EPS estimate recorded during the first month of the third quarter was larger than the 5- year average, 10-year average, 15-year average, and 20-year average.
While analysts were decreasing EPS estimates in aggregate for the third quarter, they were also decreasing EPS estimates in aggregate for the fourth quarter. The bottom-up EPS estimate for the fourth quarter declined by 2.4% (to $59.26 from $60.73) from June 30 to July 28.
This combination of lower expected earnings and higher stock prices means valuation multiples have expanded. All this in the face of a Fed that is continuing to raise rates.
Indeed, a quick look at the two biggest companies by market cap-Apple (AAPL) and Microsoft (MSFT)-shows that these two $2 trillion stocks are far from cheap.
Price/Sales (P/S) is a cleaner look than the traditional Price/Earnings (P/E) which can be manipulated by accounting gimmicks and stock buybacks.


Apple now has a P/S at over 7x. This is nearly twice the median over the past decade and nearing a 10-year high. Microsoft has a P/S fast approaching 11x and more than twice the 10-year median.
For these two stocks mega-cap to carry such obscenely high P/S multiples shows just how much investors are willing to overpay for stocks.
Seasonality
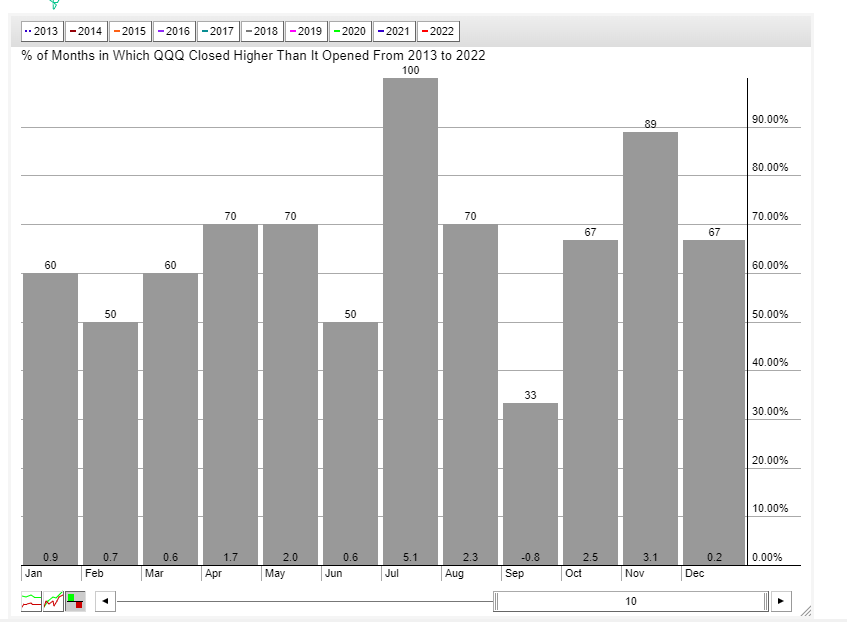
September is right around the corner. This has been by far the weakest month over the past decade for QQQ. It is the only month that has shown a loss in the past ten years and has fallen more times than it has risen in that time frame.
Maybe this time is different, but then again maybe not.
Implied Volatility
Most of you are probably familiar with the VIX. It is a measure of 30-day implied volatility in the S&P 500 options.
It is called the Fear Index by some since it tends to spike when stocks drop sharply and fall when stocks rally. The VXN-or Vixen- is a similar measure for the NASDAQ 100 stocks that make up the QQQ.
The chart below shows how low comparative levels in VXN tend to correspond well with short-term tops in the QQQ. Buy stocks when VXN is high as panic sets in and sell stocks when VXN is complacent and low.
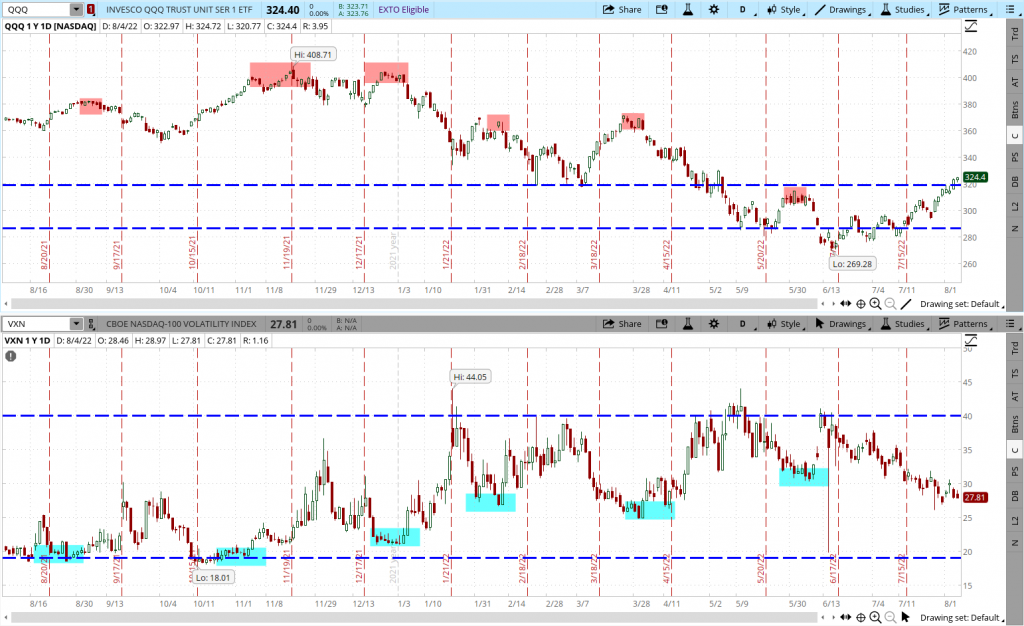
VXN has dropped significantly from the recent highs near 40. Currently it sits under 28 and at the lowest levels since last April which marked a significant short-term top in QQQ. If history holds, a pullback in QQQ is in the offing.
Low levels of IV also means option prices are cheaper. Implied volatility, at its core, is just another way to say the price of an option.
This favors option buying strategies when constructing trades. So, investors and traders who are looking to take a bearish stance would be wise to consider buying QQQ puts in place of shorting the underlying.
The risk is limited to the premium paid plus option prices haven’t been this cheap-and QQQ this expensive, in several months.
This is a strategy we use week in and week out in the POWR Options Portfolio. Trading is all about probabilities, not certainty. Time to put the probabilities in your favor with a QQQ put purchase.
What To Do Next?
While the concepts behind options trading are simpler than most people realize, applying those concepts at the right time to consistently make winning trades is no easy task.
The solution is to let me do the hard work for you…by starting a no-obligation 30 day trial to my POWR Options newsletter.
With the quantitative muscle of the POWR Ratings as my starting point, I’ve uncovered some of the best options trades in the tough markets we’ve experienced this year
That’s because I take advantage of both call and put options trades to generate big gains in ALL market conditions.
In fact, since launching the service in November 2021 I have delivered a market beating +105.4% return for my subscribers.
The good news is that you can become a subscriber today for just $1.
During your $1 trial you’ll get full access to the current portfolio, my weekly market insights and every trade alert by text & email.
Plus, I’ll be adding the next 2 exciting options trades (1 call and 1 put) when the market opens this Monday morning, so start your trial today so you don’t miss out!
About POWR Options & $1 Trial >>

About the Author: Tim Biggam

Tim spent 13 years as Chief Options Strategist at Man Securities in Chicago, 4 years as Lead Options Strategist at ThinkorSwim and 3 years as a Market Maker for First Options in Chicago. He makes regular appearances on Bloomberg TV and is a weekly contributor to the TD Ameritrade Network "Morning Trade Live". His overriding passion is to make the complex world of options more understandable and therefore more useful to the everyday trader. Tim is the editor of the POWR Options newsletter. Learn more about Tim's background, along with links to his most recent articles.
4 Big Reasons Why the Bear Rally Is Nearing an End… StockNews.com


