Volatility is an important measure that can be confusing to new options traders. We’ve talked before about how every option trade is also making a prediction about volatility. Bearish on volatility? You want to be short options or spreads! Bullish on volatility? You want to be long options or spreads!
That sounds good on paper, but in practice, how can you actually tell whether volatility is high or low?
Here are three strategies to do just that.
1. Calculate the VIX
The CBOE Volatility Index, or the VIX, is one of the best tools that traders can use to judge macro volatility. In a nutshell, the VIX measures the expected size of the (^IN) ’s price movement over the upcoming 30-day period.
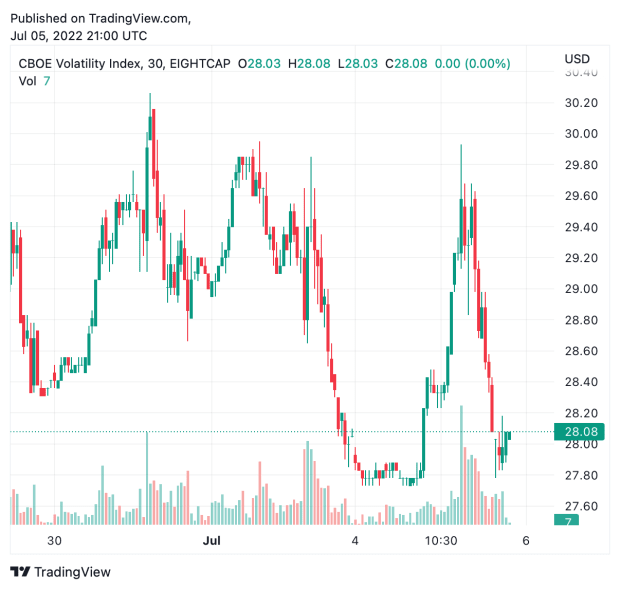
Looking at a chart of the VIX, we can see that volatility has come down a bit today. But what does the number on the VIX actually represent? You can use a simple equation to answer that question:
The VIX / 16 = Expected daily percentage move in the S&P over the next 30 days.
Market Rebellion Co-Founder Pete Najarian breaks it down in this clip.
“The reality is this: At a 16 VIX, that means the S&P has to move 1% per day, every single day And so, “is that happening?” And then you get to 32 — okay, well now you gotta move 2% every single day.”
Using today’s (^VIX) as an example (according to the chart shown above), the calculation would be $28.08 / 16 = 1.755% expected daily percentage move in the S&P over the next 30 days.
So now you ask yourself the same question Pete was asking; “Is that happening?” Do you believe that S&P 500 is capable of making average moves that size over the next 30 days? Is this undershooting it? Overshooting it? Predicting future volatility is one way to make a judgment call on volatility.
But it isn’t the only way to judge the VIX. Instead of looking into the future, you can simply look in the rearview mirror…

2. Compare the VIX to its Historic Averages
Strip away what the VIX “means” and you’re left with a data set spanning decades. A data set that many have analyzed, putting together all kinds of averages. If you’re judging volatility on a short-medium term basis, you might find it helpful to know that the mean average VIX closing price in 2022 is $26.40, with a total range of $16.60-$36.45.
Curious about how that stacks up to the 5-year mean average? The mean average closing price for the VIX from January of 2018 through present day is $20.92, with a total range of $9.15 (Early 2018) through $82.69 (Peak Covid-19 panic — a multi-decade VIX record!)
You’ll notice we’re referencing the mean average — that’s the classic average where all of the values are added together and the sum is divided by the total number of values. But what about the median and mode?
A median average is determined by ordering all of the values in a data set from least to greatest and taking the exact middle value. This can be a powerful tool for dealing with extreme outliers. Though this data is about 8 years old (using values from January 2004 through January 2014), one might still find it interesting that the median VIX during this ten-year period was $17.1.
And what about the mode? A mode average is a measure of which value in a dataset showed up most frequently. In this case, the statistician rounded each closing VIX value to the nearest whole number, and got a mode of 13! The second highest was 12. This indicates that although the median and mean averages were higher, when volatility fell to the $12-$13 zone, it really hung out there for a while.
Using averages like these, you can make a raw conclusion about whether the VIX is currently above or below average!
The VIX is a macro indicator, but what about taking a more honed approach on judging volatility?
Ready to start trading? Try Unusual Option Activity Essential. Learn how you can follow the "smart money" with a fresh UOA trade idea each week - including technical levels so that you know where to enter and exit!
3. Measure Implied Volatility With IV Rank
For that, we look at IV rank. The IV here stands for implied volatility, which measures the option market’s expectation for upcoming moves in a specific assets price. IV is an important metric to keep an eye on for any option trader because IV directly relates to how much extrinsic value is priced-in to an option contract. However, comparing the IV of two different stocks is a lot like comparing apples and oranges. That’s why we use IV rank!
IV rank measures the current IV of at-the-money options in a security against its own IV over the past year, resulting in a percentage. Let’s look at this in practice for an example of why you can’t reasonably compare the IV of two different stocks without including IV rank in the calculation.
Let’s look at a comparison of Amazon (AMZN)’s current 30-Day IV, and how it ranks against classic meme stock AMC’s IV.
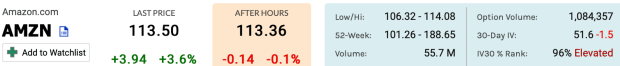
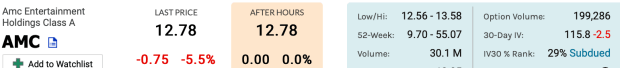
Notice that Amazon’s 30-Day IV (its average IV reading over a 30-day period) is 51.6 — less than half that of AMC’s 115.8. So Amazon has lower volatility, right? On a literal basis, sure. But from the perspective of historical averages (using IV rank), Amazon’s IV is currently higher than it has been 96% of the past year. That’s pretty high. Comparatively, AMC’s IV rank is just 29% — meaning the IV has been higher 71% of the time over the past year!
With this data, you now have to make a judgment about whether that’s valid. Ask yourself, is there a good reason why Amazon’s volatility is so high? Do you expect it to continue charting a course higher? If so, you would want to use long option strategies to tackle this trade. On the other hand, if you think it’s more likely “overdone”, and that the IV is bound to fall over time, you’d want to consider short option strategies.
The Bottom Line: Keeping an eye on volatility while trading is like keeping an eye on your speedometer while driving. On its own, this measure isn’t enough to get you to your destination. But if you aren’t paying attention, you might be putting yourself in danger. On the other hand, mastering market volatility will help give your option trades an edge — and these three strategies are a great place to start.