
What a year it has been. When 2023 kicked off, inflation was running strong, the Fed was still raising rates and a recession was on everyone’s radar. To some extent, that's still the case.
Yet the employment market has remained strong, earnings have been relatively stable and the AI trade came to life.
With names like Tesla (TSLA) plunging to start the year and Apple (AAPL) hitting 52-week lows on the first trading session of 2023, sentiment was incredibly bearish.
Don't Miss: Trading Apple as Stock Verges on $3 Trillion Market Cap
That’s why it has surprised many investors to see the Nasdaq sitting with a near-32% year-to-date gain as we are at the halfway mark of the year, while the S&P 500 is up about 16%.
It's been a strong six months of gains.
Seasonally, the stock market tends to perform pretty well in the first part of July, so we very well might see a short-term continuation to the upside. Outside of that, though, investors are wondering what to expect for the third quarter and the second half of 2023.
Let’s look at the four major US indexes, in order by year-to-date performance.
Can the Nasdaq Keep Up the Strength?
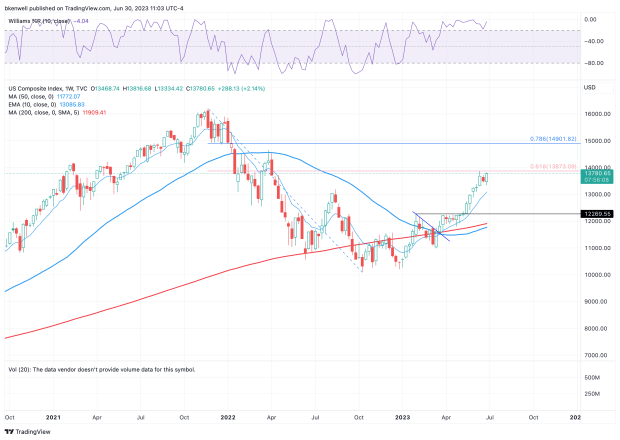
Chart courtesy of TradingView.com
Note the recent strength in the Nasdaq. It broke out over the 12,270 level and rode an eight-week win streak until it ended last week. The index is currently butting up against the 61.8% retracement near 13,875.
With the index up 36.3% from the 52-week low, investors should note that the PowerShares QQQ Trust (QQQ) has done even better, up 45%, and has made up more losses than the Nasdaq index itself.
In any regard, investors should get a pretty good feel for the Nasdaq in the third quarter based on two things.
First, how will the index handle a pullback to the rising 10-week moving average, which hasn’t been tested in about two months? It should be support if the trend remains favorable for the bulls. If it doesn't hold as support, that could open the door back to a retest of the 12,270 breakout area.
Second, if the Nasdaq instead continues higher, can we get a weekly close above the 61.8% retracement? If so, that could put the 78.6% retracement and 15,000 level in play next.
The S&P 500: Look Out for 4,535
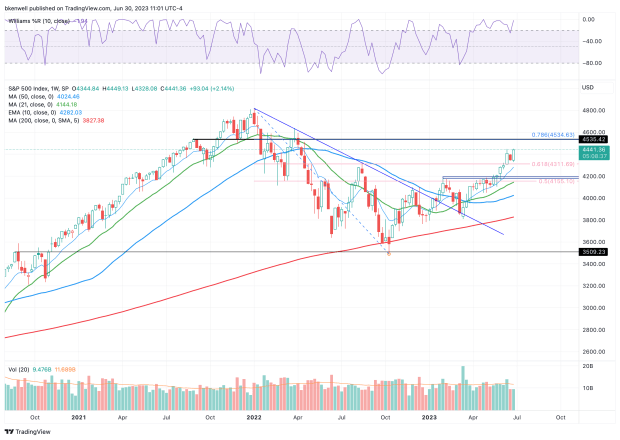
Chart courtesy of TradingView.com
In December, the S&P 500 was able to put in a higher low as buyers stepped in around the 3,750 to 3,800 area. That helped set up a breakout over downtrend resistance (blue line) and then the eventual breakout over 4,200.
If the S&P 500 can gain traction over 4,450, then 4,500 is the next most logical target. However, the 78.6% retracement stands out quite clearly on the weekly chart, up near 4,535.
This level was support in late 2021 near the end of the bull market, but notice how the index sliced below this measure in January 2022 and how it turned into resistance from there.
Were it to pass 4,535 and 4,600, nothing would stop the S&P from returning to 4,750 or higher — at least, technically speaking — and potentially giving the all-time high a test up near 4,818.
On the downside, watch 4,300 and the 10-week moving average. A breakdown below this area puts the 4,200 breakout zone back in play. A larger breakdown below 4,000 could open the door to 3,800 and the 200-week moving average.
Many investors prefer the S&P 500 ETF Trust ETF (SPY), although the index’s levels and measures can be roughly translated to this ETF.
The Russell 2000: Pushing Into Resistance
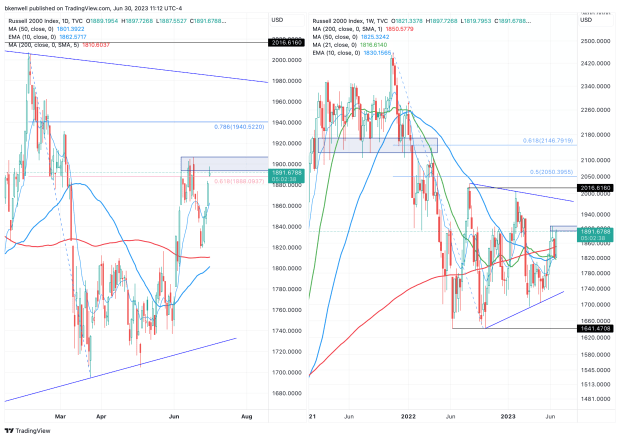
Chart courtesy of TradingView.com
The Russell 2000 is riding a five-day, 4.3% rally off the recent low. That has helped shore up its year-to-date performance, as it's now up about 6.5%.
The index is pushing into the 1,910 to 1,920 resistance area and sellers are leaning into this area on Friday. If it can push through this zone, it opens the door to 1,940 in the short term, then 1,975 to 1,980.
If we zoom out to the weekly chart (on the right), the bulls obviously have their eye on the 2,000 level. If it goes above that mark, there is a path to 2,050, then the 2,125 to 2,150 zone.
Admittedly, those levels are far away at this moment, but when we are measuring in months instead of days, we must look at the larger potential moves.
On the downside, the bulls want the Russell 2000 to hold 1,800. A break below that mark could open the door to the low-1,700s, followed by a potential test of 1,640 if the selling really picks up pace.
For those looking at the ETF, that’s the iShares Russell 2000 ETF (IWM).
Can the Dow Jones Industrial Average Catch Up?
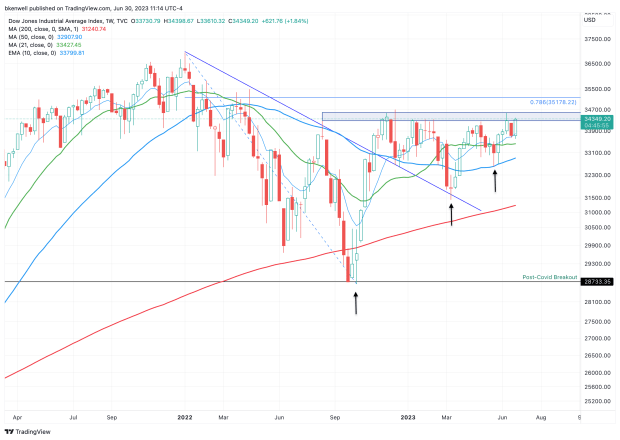
Chart courtesy of TradingView.com
The Dow Jones Industrial Average has been a mixed bag. It sports a year-to-date gain of just 3.5% and badly lags its index peers so far this year. But when we go back to January 2021 — in other words, the end of the prior bull market — the Dow is down just 5.5%.
That performance is better than all the indexes above. Further, it’s down the least from its all-time high compared to the other three indexes, and when you look at the charts, it’s pretty impressive.
The Dow continues to put in a series of higher lows, as annotated with the arrows on the chart above. At the same time, it continues to struggle with the 34,300 to 34,600 zone.
Note that this area contains the high from the third quarter and fourth quarter of 2022, as well as the first-quarter and now the second-quarter high from 2023.
This resistance area is setting up as a potential breakout zone in the second half.
If the Dow can clear this zone, it opens the door to the 78.6% retracement near 35,175. Above 35,500 and the next 1,000 to 1,500 points could very well be on the upside, which could send the Dow back to all-time highs.
If the Dow can’t break out over this zone, it keeps the 32,500 to 32,700 area on watch.
That’s the May and June low, as well as the 50-week moving average. Below this measure also puts the Dow below all its major daily moving averages. And if it fails to hold, it could open the door down to the 2023 low and the 200-week moving average near 31,500.
For those interested in the ETF version, consider the SPDR Dow Jones Industrial Average ETF (DIA).
The Bottom Line
Many indexes are either sitting on the cusp of a breakout or have already enjoyed a major upside rally. Some sort of shakeout or pullback would be quite healthy given the momentum we’ve seen lately and the fact that there are still larger headwinds to navigate (such as the Fed and economic worries).
Should we see some sort of rotation in the third quarter and/or second half of 2023, look for strength in the small caps and potentially in the Dow.
That’s assuming the bull market broadens out from megacap tech and into other beaten-down names. But don’t forget that investors could also rotate out of stocks completely and all the indexes could struggle in the second half.
If that’s the case and we do get a sizable pullback, the larger trend still remains with the bulls. But if the market begins to lose some of the major support areas outlined above, investors may have to shift from a buy-the-dips mindset to a one that’s much more cautious and tactical.
Good luck.
July 4th Sale! Get investment guidance from trusted portfolio managers without the management fees. Sign up for Action Alerts PLUS now for 75% off.